Abstract
Object: Identification of the nature, features, parameters, and socio-economic causes of the NEET youth phenomenon in both world and domestic conditions.
Methods: Methods of system, structural-functional, comparative, statistical analysis.
Results: The nature of NEET youth, latent causes, and systemic factors of its genesis and development are revealed; a categorical apparatus of the socio-economic space of NEET youth is specified; the NEET youth segment and its parameters in both world and domestic conditions are structured.
Conclusions: If ignored, both phenomenon and current state of NEET youth may lead to stale and stable, stagnant unemployment in the future, which further aggravates both social and macroeconomic issues. Since today the NEET youth segment is increasing, it is necessary to develop a comprehensive model of its reduction based on convergence of three components: productive employment (to form the motivation of NEET youth to work); post-industrial education (to acquire professional skills in information environment and globalizing context of their appliance); and inclusive development (as a constant of modern socialization of the economy.)
In the world of economic science and practice, young people play a prominent role in shaping the wellbeing of society as a whole and, inter alia, their own segment. At the same time, unemployment among young people and their inefficient employment remain one of the pressing challenges of the day.
The International Labour Organization (ILO) report «Global Employment Trends for Youth 2017», estimates the share of young people in the total number of unemployed in the world at more than 35 %. In 2017, the youth unemployment rate amounted to 13.1 % (13.0 % in 2016, 12.9 % in 2015) with a total number of unemployed young people of 70.9 million people (71.1 million people in 2018). However, this is significantly less than at the peak of the global economic crisis back in 2009 when the number of unemployed youth amounted to 76.7 million people (the International Labor Organization report «Global Employment Trends for Youth 2017: Paths to a better working future»).
The ILO Report lists the following trends of inefficient and unproductive youth employment as relevant for developing countries and emerging market countries in 2017:
– Youth working extreme poverty (less than $1.90 per capita per day) rate of 39 % (160.8 million people), or moderate poverty (that is, between $1.90 and $3.10). For adult workers, this rate is 26 %;
– More than two out of five young people in the modern labor force are either unemployed or employed but live in poverty.
– Out of every twenty working young people, nineteen are employed informally.
In developed countries, employed youth are more at risk of relative poverty (that is, their average income is less than 60 %). To illustrate, in 2014 (the latest available comparable data), the EU-28 countries have shown the share of young people in the total number of employed in the category of those at risk of poverty as 12.9 %, compared to 9.6 % among working adults aged 25–54. In addition to low wages, young people often work in informal sector, part-time or temporarily. For example, in 2014 in the EU-28 the share of young people employed part-time or temporarily was about 29 % and 37 %, respectively (Report of the International Labour Organization «Global Employment Trends for Youth 2017: Paths to a better working future»).
Post-Soviet countries show similar trends: one of the main issues is a significant number of young people working in the informal sector. In other words, it is quite easy for a young person to find a job, but the quality of jobs remains low; many of them are provided by the informal sector.
At the Youth Forum in December 2019, the President of Kazakhstan Kassym-Jomart Tokayev, justifying the need to modernize comprehensive programs to support youth, has emphasized the following: «Unfor- tunately, the number of so-called NEET youth who do not study and do not work is growing. According to sociologists, more than 20 % of the young people surveyed are forced to stay home after graduation. At the same time, three out of four young people have no involvement in public life whatsoever…» (https://khabar.kz/ru/news/item/117899-k-tokaev-zakryl-god-molodezhi-i-dal-start-godu-volonterov).
Indeed, along with the features of the modern market leading to objective unemployment due to a change in employment paradigms (an increase in frictional unemployment), we should also note a growing alarming trend: the growth of young people in the NEET (Not in Employment, Education or Training) category associated with two types of statuses: NEET unemployment (unemployed youth, whose number increases sharply during crises and negative economic shocks) and NEET inactivity (inactive youth outside the education system) (Carcillo et al., 2015).
The problem of reducing the NEET youth segment has become relevant all over the world since the end of the last century. However, in the conditions of our country, this problem is not in the focus of priority, although the experience of developed countries is partially used in this context. Qualitative differences of our socio-economic environment do not help the system analysis either. Accordingly, higher standards of social protection, a high level of production potential of developed countries allow them to detail the problem of NEET youth and find system tools for its optimal compression. IT diversification leads to the emergence of innovative business platforms, which stimulates the development of youth entrepreneurship and naturally narrows the parameters of its NEET group. The wide spread of various forms of socialization of the business environment also allows reducing a certain part of the NEET youth.
The ways for young people to end up in the NEET category and the possibilities of getting out of it are studied poorly and are based on multifactorial theories of human capital, in particular:
- J. Heckman, P. Carneiro emphasize the intra-family factors of raising and motivation (Heckman, Carneiro, 2003).
- G. Solon with the hypothesis of determining the quality of human capital by the accumulated socioeconomic and cultural inequality of different families (Solon, 2004). For instance, young people from families with limited socio-economic opportunities will be at high risk of falling into the NEET segment by default, thus forming its «core» (Youths NEET Census Report, 2015).
- A. Inui (Inui, 2005), G. Yuji (Yuji, 2005) justify the recognition of young people as NEET due to lack of financial support.
- J. Bynner (Bynner et al., 2000), S. Parsons (Bynner, Parsons, 2002), S. Alfieri (Alfieri et al., 2015) highlighting family, intergenerational and educational causes of emergence of NEET youth (social status, family, education of the parents, place of living, educational achievement of children at an early age, etc.);
- D. Gladwell with the hypothesis that the lack of cognitive skills is the main factor for the young people falling into the NEET segment (Gladwell et al., 2016);
- Y. Chen stating that the NEET status is not a voluntary choice for the vast majority of young people in this segment (Chen, 2009).
There are also few studies of the socio-economic effects of staying in the NEET segment. As the main negative consequences for former NEETs, when the young people cease to belong to this group due to age, the researchers identify the following aspects:
- S. Crawford (Crawford et al., 2010), B. Cockx, M. Picchio (Cockx, Picchio, 2011) state the reduction of the possibility of finding a permanent job in the future;
- P. Gregg, E. Tominey (Gregg, Tominey, 2005), J. Wadsworth (Wadsworth J., 2013) suggest the growth of future risks of low-skilled and low-paid employment;
- Coles B. (Coles et al, 2002) puts forward poverty and dependence on transfers (assistance from the family and the state).
In addition, E. Kelly and S. McGuinness suggest that during crises and recessions the segment of NEET youth is significantly expanding and the opportunities to leave it are sharply reduced (Kelly, McGuinness, 2013). At the same time, researchers such as P. Gregg, E. Tominey (Gregg, Tominey, 2005), A. Samoilenko, K. Carter (Samoilenko, Carter, 2015) believe that the negative consequences of staying in the NEET status can be offset over time.
To achieve analytical results we used a number of methods while writing this paper. In particular, to substantiate theoretical concepts of the NEET youth phenomenon we used a systematic and structural- functional analysis; when studying the parameters of NEET youth in the world and domestic conditions we applied systematic and comparative approaches.
The NEET youth issue was first raised in the UK in 1999 in the Social Exclusion Unit Report «Bridging the gap: New opportunities for 16–18 year olds not in education, employment or training» (Report by the Social Exclusion Unit, 1999). The NEET youth category has been introduced into international statistics in early 2000s as a more informative alternative to the indicator of the youth unemployment level, which fails to give a reliable picture of the young people employment and is calculated as the ratio of unemployed youth to the number of economically active youth (Varshavskaya, 2015). The NEET youth category is more representative as it takes into account the factor of social exclusion, demonstrating the non-inclusion of young people in the labor market and the education system.
In 2010 Eurostat developed a standardized definition of NEET youth: young people aged 15 to 24 neither in employment nor economically active. Selected countries have expanded the age range of this category: with a lower limit of 16 years (the approach applied by the U.S. Bureau of Labor Statistics) and an upper limit of up to 29 years (DeSilver, 2016).
The ILO manual «Decent work indicators: guidelines for producers and users of statistical and legal framework indicators» defines NEET-youth as the percentage of youth who are not in employment and not in education or training as a of the total number of youth (ILO manual, 2013).
Each country has its own peculiarities in the causes of the emergence of NEET youth, and at the same time the education system, the labor market and general attitudes to socialization face new challenges. In this regard, there is a need to systematize the objective and subjective factors that cause the growth of this category in a particular country (Kazakhstan in our case) to actualize this issue. However, despite the urgent need to study NEET youth to develop mechanisms for their comprehensive reduction, such studies are currently quite rare both in Kazakhstan and abroad. In addition, based on the Kazakhstan realities, it is important to investigate the socio-economic causes and factors of young people falling into the NEET segment, the possibilities of getting out of it, the peculiarities of transitions between the states of training and NEET inactivity, employment and NEET unemployment, as well as to assess the consequences and risks of long-term stay as NEET. Therefore, the issue of reducing this category of young people becomes not only a macroeconomic problem, but also a problem of transforming the entire social block of social development from humanization and professional diversification of education, changes in the quality of human capital, to problems of social alignment with the growing trend of an inclusive economy.
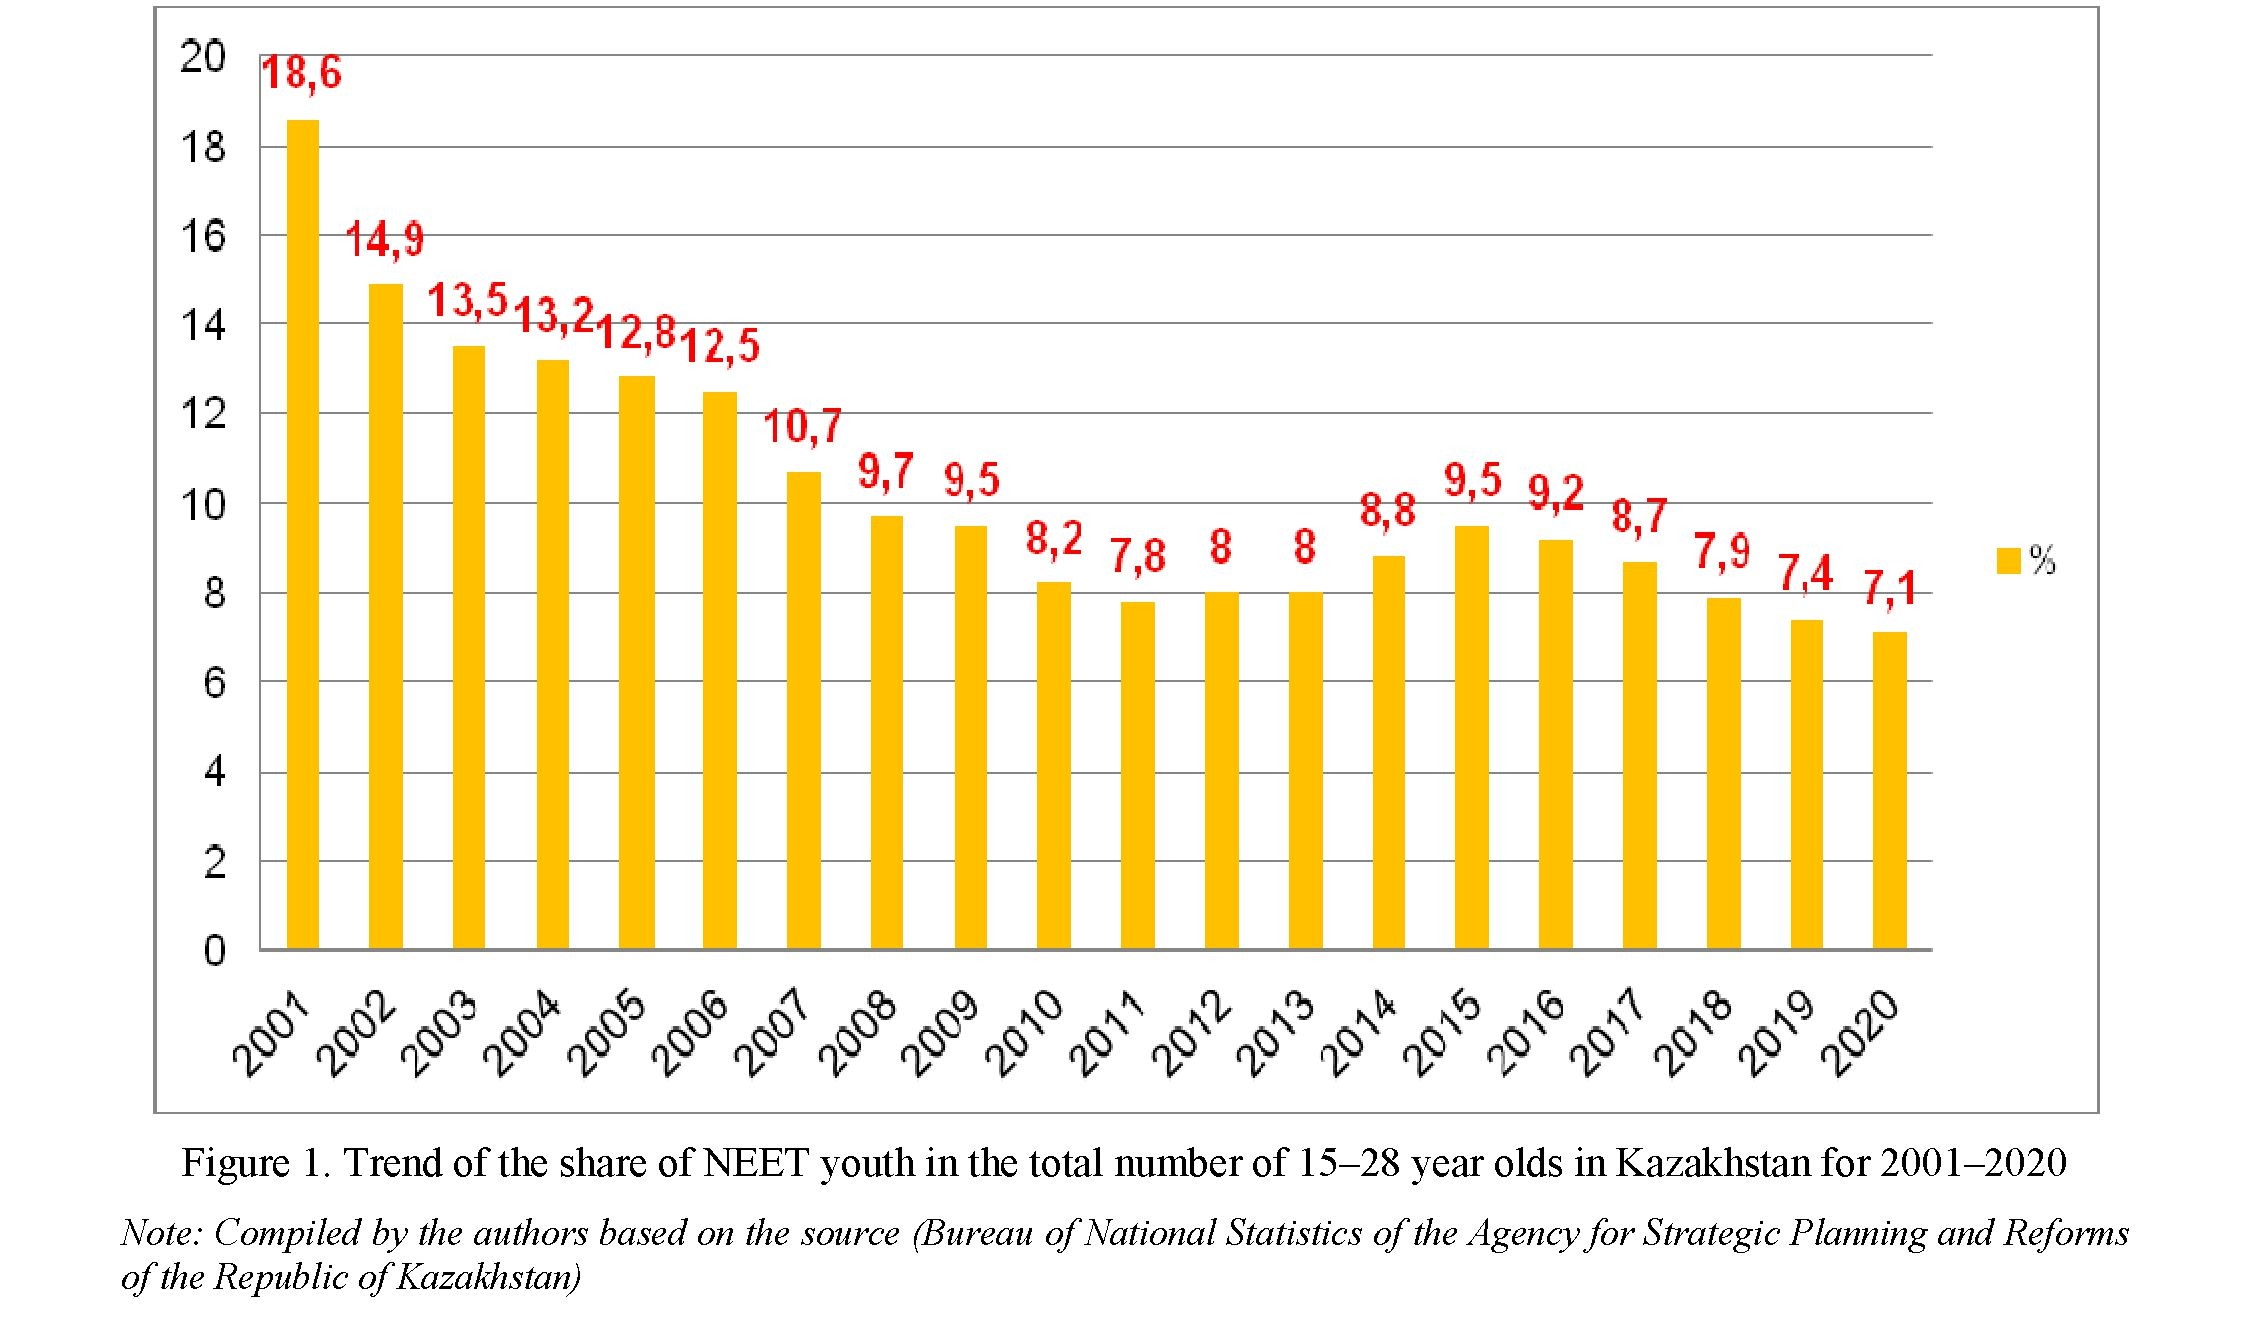
In Kazakhstan the share of NEET youth in 2020 was 7.1 %, showing a downward trend for the period from 2001 to 2020 (Figure 1).
In addition to the above, the highest rates are recorded in the southern and western regions: the Aktobe region (8.4 %), the Kyzylorda region (8.3 %), the Turkestan region (8.0 %), and the Karaganda region (11.5 %). At the same time, for the period from 2001 to 2020 the share of NEET youth showed a significant decrease, particularly in such regions as West Kazakhstan region (from 22.5 % to 3.1 %), Kostanay region (from 17.6 % to 5.3 %), Pavlodar region (from 14.2 % to 4.9 %), Atyrau region (from 20.5 % to 5.5 %), and Almaty (from 16.3 % to 6.1 %) (Table 1).
Table 1. Trend of the NEET youth percentage in the total number of 15–28 year olds in Kazakhstan for 2001—2020, %
Note: Compiled by the authors based on the source (Bureau of National Statistics of the Agency for Strategic Planning and Reforms of the Republic of Kazakhstan)
|
2001 |
2005 |
2010 |
2015 |
2018 |
2019 |
2020 |
|
|
The Republic of Kazakhstan |
18,6 |
12,8 |
8,2 |
9,5 |
7,9 |
7,4 |
7,1 |
|
Akmola region |
17,6 |
15,4 |
7,5 |
8,1 |
5,9 |
6,2 |
7,5 |
|
Aktobe region |
15,2 |
9,1 |
3,2 |
9,0 |
8,5 |
8,1 |
8,4 |
|
Almaty region |
22,2 |
13,2 |
8,2 |
9,2 |
7,0 |
7,2 |
7,2 |
|
Atyrau region |
20,5 |
13,4 |
9,5 |
8,0 |
6,8 |
5,2 |
5,5 |
|
West Kazakhstan region |
22,5 |
15,7 |
9,7 |
5,1 |
2,9 |
2,8 |
3,1 |
|
Zhambyl region |
18,1 |
20,8 |
7,3 |
15,2 |
8,0 |
7,6 |
7,1 |
|
Karaganda region |
19,9 |
11,5 |
10,2 |
14,1 |
12,5 |
12,3 |
11,5 |
|
Kostanay region |
17,6 |
9,5 |
8,1 |
7,5 |
4,9 |
4,7 |
5,3 |
|
Kyzylorda region |
31,8 |
14,6 |
9,4 |
10,9 |
8,2 |
8,2 |
8,3 |
|
Mangystau region |
15,5 |
14,2 |
13,3 |
12,0 |
7,1 |
8,0 |
7,8 |
|
South Kazakhstan region |
19,5 |
10,2 |
7,8 |
9,7 |
- |
- |
- |
|
Pavlodar region |
14,2 |
10,0 |
6,1 |
7,1 |
5,3 |
4,9 |
4,9 |
|
North Kazakhstan region |
16,6 |
11,4 |
7,2 |
7,6 |
9,5 |
7,1 |
6,8 |
|
Turkestan region |
- |
- |
- |
- |
13,3 |
10,7 |
8,0 |
|
East Kazakhstan region |
14,5 |
14,4 |
10,0 |
9,4 |
5,7 |
5,6 |
6,6 |
|
Nur-Sultan |
10,6 |
8,3 |
11,9 |
6,8 |
7,1 |
6,8 |
7,0 |
|
Almaty |
16,3 |
14,9 |
5,8 |
8,6 |
6,3 |
6,1 |
6,1 |
|
Shymkent |
- |
- |
- |
- |
9,1 |
8,7 |
7,7 |
Kazakhstan is known for a significant regional differentiation of the level of this indicator. That said, in 2020 the largest share of NEET youth was observed in Karaganda (11.5 %), Aktobe (8.4 %), Kyzylorda (8.3 %) and Turkestan (8.0 %) regions, which is one and a half times higher than the national average (7.1 %) (Figure 2). At the same time, in recent years this indicator has been decreasing in Atyrau, Zhambyl, Pavlodar, East Kazakhstan regions and in the cities of Nur-Sultan and Almaty.
According to the Bureau of National Statistics of the Agency for Strategic Planning and Reforms of the Republic of Kazakhstan, the most unemployed young women and men live in Almaty, Karaganda region, and Nur-Sultan: 5.9 %, 5.0 %, and 4.6 %, respectively. The anti-leaders in the youth unemployment level among men are Almaty (5.5 %), North Kazakhstan region (4.8 %), and Nur-Sultan (4.6 %).
The most female youth unemployment rate was recorded in the Karaganda region (8.4 %), Almaty (6.2 %), and the Kyzylorda region (5.3 %) (Table 2).
Table 2. The youth unemployment level in Kazakhstan for 2020, %
Note: Compiled by the authors based on the source (Bureau of National Statistics of the Agency for Strategic Planning and Re-
|
Total |
2020 |
||
|
Men |
Women |
||
|
The Republic of Kazakhstan |
3,8 |
3,3 |
4,5 |
|
Akmola region |
3,2 |
3,0 |
3,4 |
|
Aktobe region |
2,9 |
2,9 |
3,0 |
|
Almaty region |
3,4 |
2,5 |
4,4 |
|
Atyrau region |
2,4 |
2,4 |
2,4 |
|
West Kazakhstan region |
3,9 |
3,5 |
4,4 |
|
Zhambyl region |
2,9 |
2,9 |
3,0 |
|
Karaganda region |
5,0 |
2,5 |
8,4 |
|
Kostanay region |
3,2 |
2,6 |
3,8 |
|
Kyzylorda region |
4,3 |
3,4 |
5,3 |
|
Mangystau region |
3,6 |
3,2 |
4,2 |
|
Pavlodar region |
3,0 |
2,6 |
3,4 |
|
North Kazakhstan region |
3,9 |
4,8 |
3,0 |
|
Turkestan region |
3,4 |
3,2 |
3,8 |
|
East Kazakhstan region |
3,2 |
2,6 |
3,9 |
|
Nur-Sultan |
4,6 |
4,6 |
4,6 |
|
Almaty |
5,9 |
5,5 |
6,2 |
|
Shymkent |
3,7 |
3,1 |
4,4 |
forms of the Republic of Kazakhstan)

The age group of 25–28 is dominated by the largest number of unemployed young people: 3.9 %. The share of youth unemployment aged 20–24 is 3.8 %. The share of youth unemployment aged 15–19 is 3.2 % (Table 3).
Table 3. The share of unemployed youth aged 15–28 by age for 2020, %
|
2020 |
||||
|
Total aged 15–28 |
15–19 |
20–24 |
25–28 |
|
|
The Republic of Kazakhstan |
3,8 |
3,2 |
3,8 |
3,9 |
|
Akmola region |
3,2 |
2,9 |
3,0 |
3,3 |
|
Aktobe region |
2,9 |
1,9 |
3,6 |
2,6 |
|
Almaty region |
3,4 |
1,6 |
3,7 |
2,8 |
|
Atyrau region |
2,4 |
2,1 |
1,4 |
3,2 |
|
West Kazakhstan region |
3,9 |
- |
4,1 |
3,7 |
|
Zhambyl region |
2,9 |
0,9 |
3,2 |
3,2 |
|
Karaganda region |
5,0 |
6,7 |
4,8 |
4,4 |
|
Kostanay region |
3,2 |
2,6 |
3,1 |
3,3 |
|
Kyzylorda region |
4,3 |
4,3 |
4,9 |
3,8 |
|
Mangystau region |
3,6 |
1,8 |
3,8 |
3,4 |
|
Pavlodar region |
3,0 |
- |
2,4 |
3,3 |
|
North Kazakhstan region |
3,9 |
6,3 |
6,1 |
1,8 |
|
Turkestan region |
3,4 |
- |
2,2 |
4,4 |
|
East Kazakhstan region |
3,2 |
6,7 |
3,2 |
3,0 |
|
Nur-Sultan |
4,6 |
- |
4,8 |
4,5 |
|
Almaty |
5,9 |
- |
5,4 |
6,4 |
|
Shymkent |
3,7 |
- |
3,5 |
3,9 |
Note: Compiled by the authors based on the source (Bureau of National Statistics of the Agency for Strategic Planning and Reforms of the Republic of Kazakhstan)
The number of unemployed youth aged 15–28 years was 80,416 people or 3.8 % of the total number of NEET youth, of which 31,768 people or 1.5 % have higher education, 31,839 people or 1.5 % have secondary vocational (special) education, 3,194 people or 0.2 % have primary vocational education, and 13,615 people or 0.6 % have secondary general education (Table 4).
Table 4. The number of unemployed youth aged 15–28 years by education level for 2020
|
Unemployed population |
|
|
Population with education: |
80 416 |
|
- higher education |
31 768 |
|
- secondary vocational (special) education |
31 839 |
|
- primary vocational education |
3 194 |
|
- general secondary education |
13 615 |
|
- basic secondary education |
- |
|
- primary education |
- |
|
Note: Compiled by the authors based on the source (Bureau of National Statistics of the Agency for Strategic Planning and Reforms of the Republic of Kazakhstan) |
|
The largest number of unemployed people aged 15–28 is recorded in urban areas representing 4.2 % of the total number of unemployed youth. 3.4 % of unemployed youth live in rural areas.
In urban areas the largest percentage of unemployed youth is registered in Almaty (5.9 %), Almaty region (5.2 %) and Karaganda region (5.2 %). For rural areas: in North Kazakhstan (5.3 %), East Kazakhstan (4.9 %) and Karaganda (4.5 %) regions (Table 5).
In 2019 the «Youth» Research Center conducted a study «Sociological portrait of NEET youth in Ka- zakhstan», which revealed low wages, lack of work experience among young people, and lack of jobs in the area of residence as objective reasons for NEET unemployment. Subjective factors of youth unemployment, according to the results of a sociological survey, are the lack of desire and motivation for young people to work, paternalistic and dependent sentiments, excessively high ambitions, etc. (Sociological portrait of NEET youth in Kazakhstan, 2019).
Table 5. The share of unemployed youth aged 15–28 by level of education for 2020 by type of locality for 2020, %
|
Total |
2020 |
||
|
Men |
Women |
||
|
The Republic of Kazakhstan |
3,8 |
4,2 |
3,4 |
|
Akmola region |
3,2 |
2,7 |
3,6 |
|
Aktobe region |
2,9 |
2,6 |
3,7 |
|
Almaty region |
3,4 |
5,2 |
2,9 |
|
Atyrau region |
2,4 |
2,5 |
2,2 |
|
West Kazakhstan region |
3,9 |
3,8 |
4,1 |
|
Zhambyl region |
2,9 |
3,4 |
2,7 |
|
Karaganda region |
5,0 |
5,2 |
4,5 |
|
Kostanay region |
3,2 |
3,0 |
3,5 |
|
Kyzylorda region |
4,3 |
4,5 |
4,2 |
|
Mangystau region |
3,6 |
3,5 |
3,7 |
|
Pavlodar region |
3,0 |
3,4 |
2,0 |
|
North Kazakhstan region |
3,9 |
2,6 |
5,3 |
|
Turkestan region |
3,4 |
4,0 |
3,3 |
|
East Kazakhstan region |
3,2 |
2,3 |
4,9 |
|
Nur-Sultan |
4,6 |
4,6 |
- |
|
Almaty |
5,9 |
5,9 |
- |
|
Shymkent |
3,7 |
3,7 |
- |
Note: Compiled by the authors based on the source (Bureau of National Statistics of the Agency for Strategic Planning and Reforms of the Republic of Kazakhstan
Unfortunately, the current official data on both youth employment and unemployment in Kazakhstan do not give a complete and reliable picture of socio-economic and demographic profile of NEET youth, length of stay in this segment, its risks and consequences. This, in turn, reduces the effectiveness of numerous state initiatives to ensure productive employment of young people and their inclusion.
The results of sociological studies of NEET youth in Kazakhstan indicate that transition of young people to economic independence is quite protracted and problematic due to the entrenched inequality of young people in the labor market associated with low wages, part-time and informal employment.
The scale and specifics of NEET youth in a particular country is analyzed based on national labor force surveys. The number of NEET youth is growing naturally due to an increase in the number of Generation Z and due to a decrease in the number of other generations in the workforce.
Currently, the number of NEET youth in Europe is on average about 12.8 % of youth labor and, according to the International Labor Organization, it is one in five young people in the world. In 2018 the average share of NEET youth in OECD countries was 10.5 % among young men and 15.6 % among young women. This indicator varies by country.
In 2020 12.8 % of young people aged 20–34 living in the EU were not included in areas of employment and education, i.e., they belonged to the NEET group (Statistics on young people neither in employment nor in education or training of the European Union, 2021). This indicator significantly differentiates by country. In Luxembourg, Sweden, the Netherlands, Germany, Iceland, Switzerland, and Norway, it would not exceed 5–7 %, while a whole multitude of countries in Southern and Eastern Europe (Greece, Spain, Italy, Croatia, etc.), and Bulgaria would show a range of 18–22 % (Figure 3).
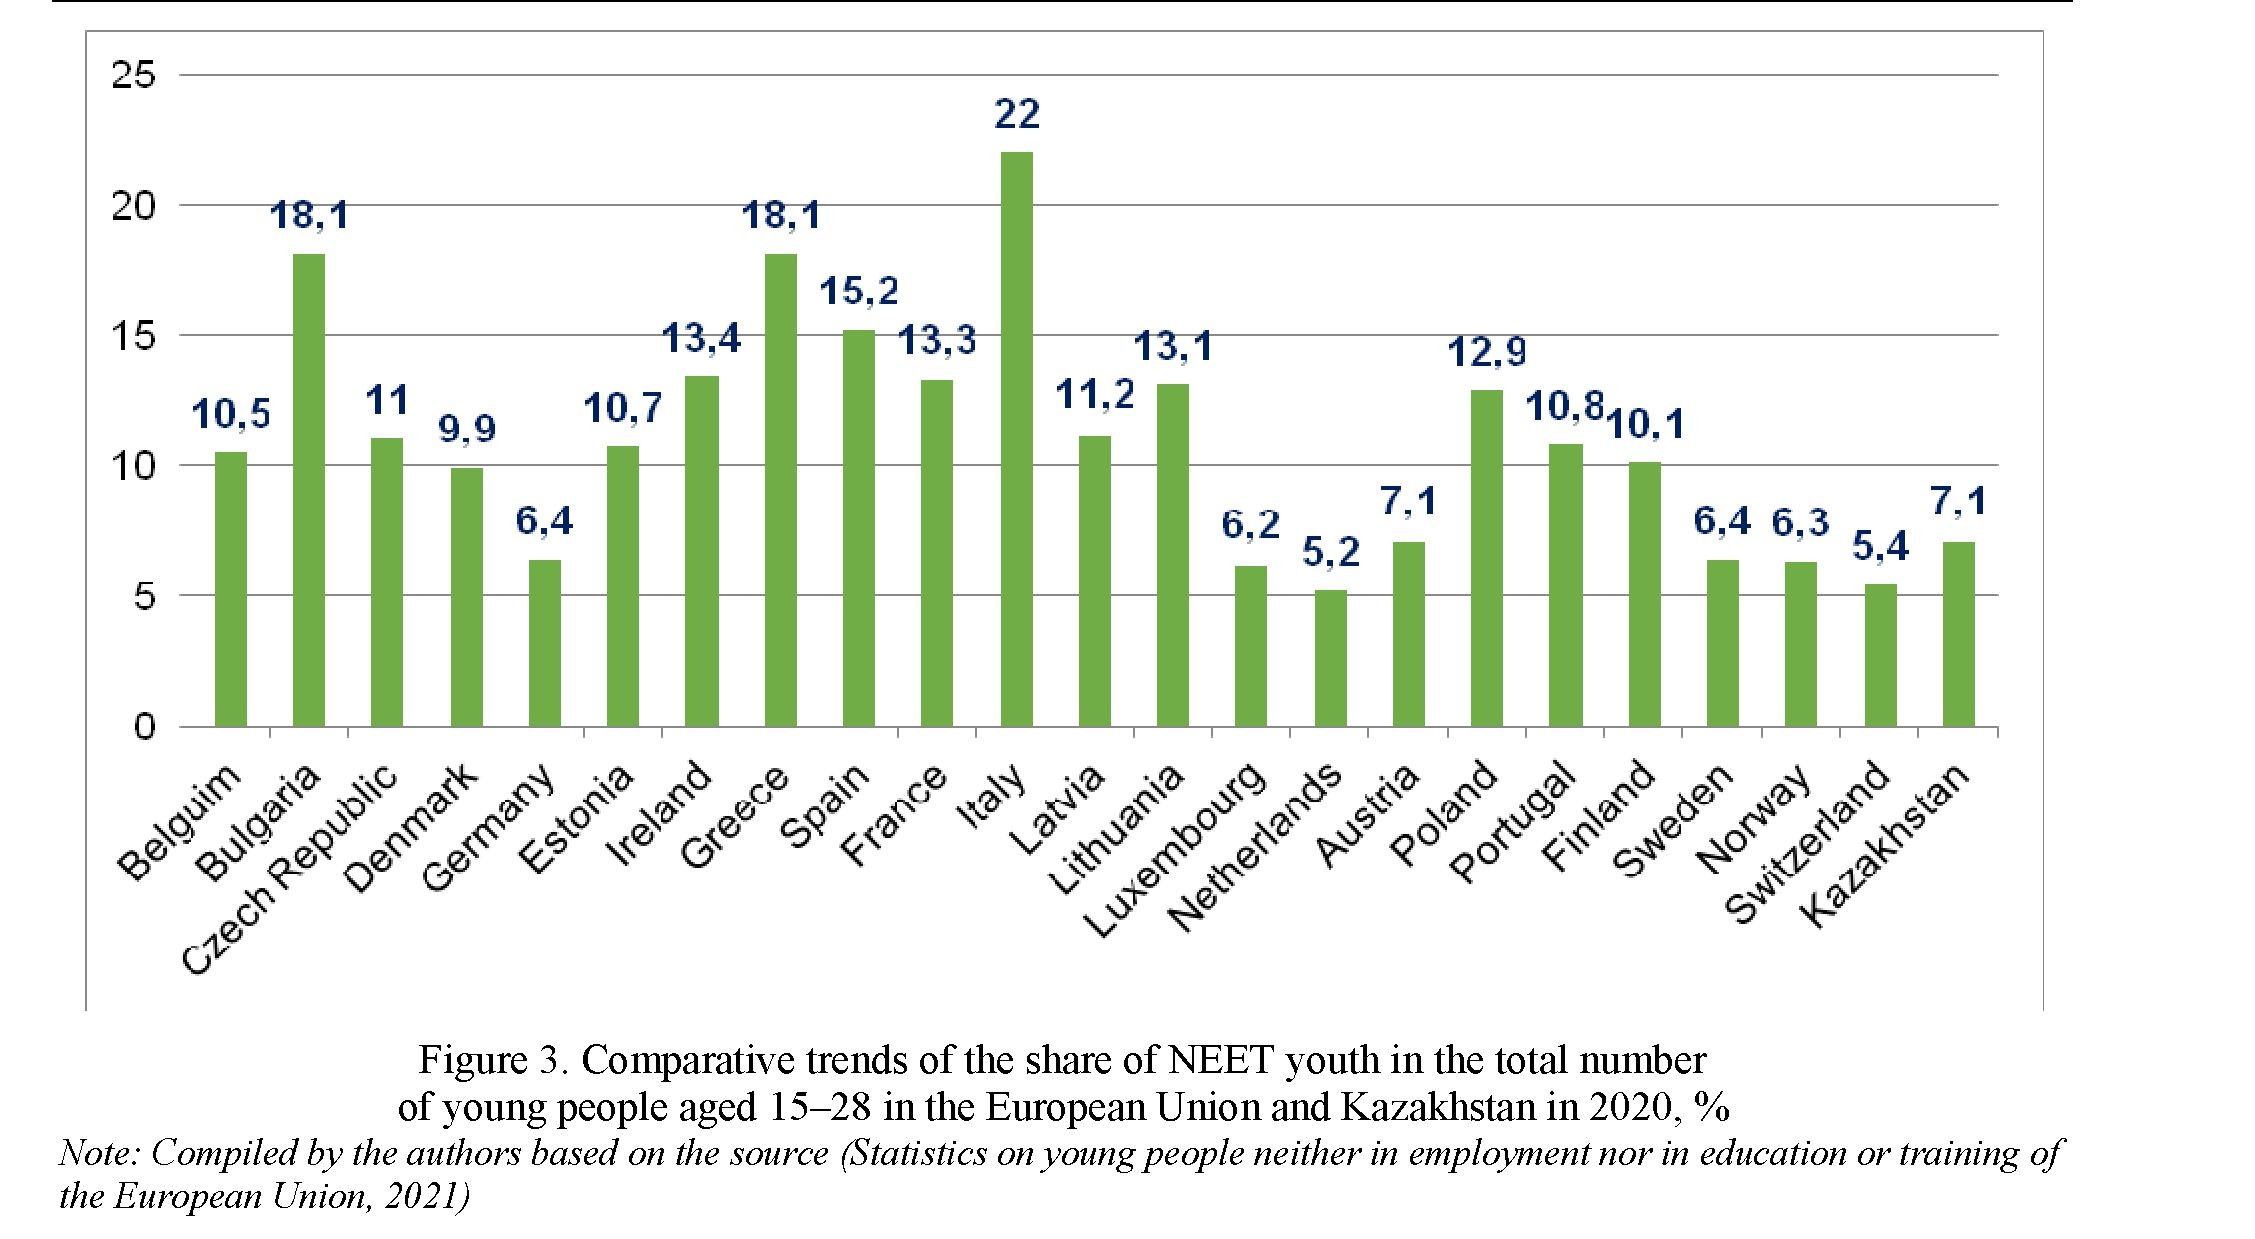
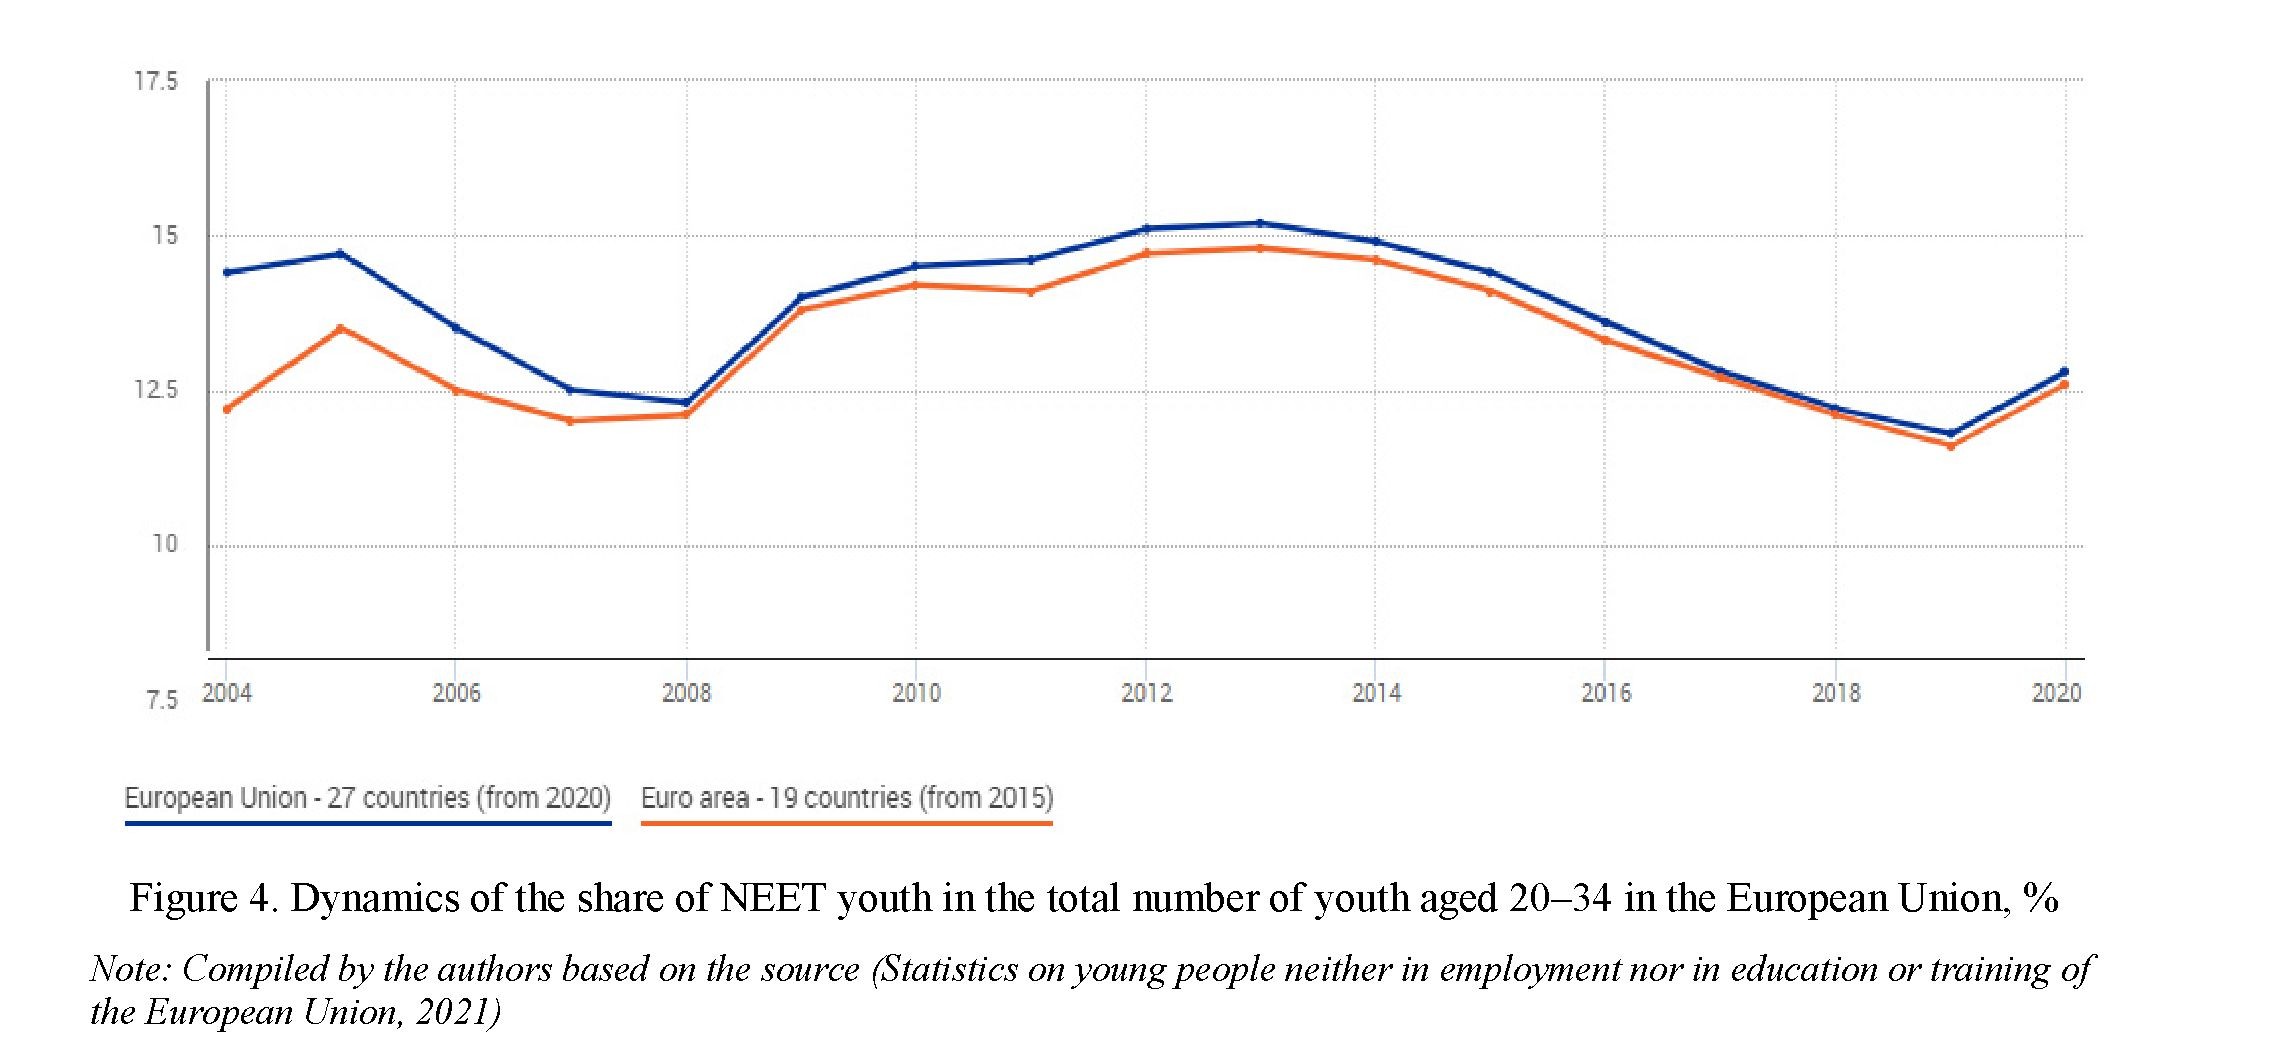
According to the Bureau of National Statistics of the Agency for Strategic Development and Reforms of the Republic of Kazakhstan, in 2020 the NEET level in Kazakhstan was close to the average of Western European countries and amounted to 7.1 %, i.e., every sixth young person aged 15–24 was neither in employment, nor education. The Eurostat database allows us to assess the trends of the NEET level in the EU since 2004. Over the period of 2004–2020 the NEET level in the EU would gradually decrease from 15.2 to 12.8 % (Figure 4).
This indicator would decrease among both young men and women (by 1.8 % and 2.9 %, respectively) and in both age groups (by 1.3 % and 3.4 %).
According to Eurostat, there is a significant difference between the sexes in relation to the percentage of young people who had neither a job, nor education and vocational training. In 2020 more than one fifth (21.5 %) of young women (aged 20–34) in the EU belonged to the NEET category, while the corresponding share among young men was 7.7 percentage points lower, i.e., 13.8 %.
Eurostat believes there is a multitude of factors that could explain this gender gap:
- Social conventions or pressures that tend to place a higher value on the role of women in the family and the role of men in the workplace;
- Career advice that can increase gender segregation and direct women to a relatively narrow range of occupational options;
- Labor market issues, such as employers who prefer to hire young men rather than young women; young women who face difficulties of assimilation when returning to work after childbirth; young women are more likely to land low-paid jobs or unstable employment.
According to the Bureau of National Statistics of the Agency for Strategic Development and Reforms of the Republic of Kazakhstan, in 2020 the level of NEET in Kazakhstan by gender was 3.8 %, which is lower than the average among European countries, i.e., every third young woman and every fourth young man in Kazakhstan are NEETs.
Among young people aged 20–34 with an average level of education, NEET indicators would range from 5.8 % in Malta to a peak of 26.0 % in Italy. For this level of education in four countries the NEET indicator has exceeded 19 % (France, Ireland, Greece, and Italy), while most countries were in the range of 11– 18 %.
As for people aged 20–34 with a high level of education, NEET indicators were generally lower than in Kazakhstan: from 4.2 % in the Netherlands to 25.0 % in Greece, while in the vast majority of EU member states the indicators would range from 6 to 14 %.
The number of unemployed NEET youth by the level of education for 2020 in the European Union and Kazakhstan differ significantly, i.e., if in Kazakhstan youth unemployment is observed mostly among young people with higher and vocational education, in Europe, on the contrary, it is mostly primary and secondary general education.
Authorized state bodies implementing youth policy, seeking to reach specific groups of young people, such as unemployed youth, people who have completed education and vocational training early on, or young people whose qualifications do not meet the needs of the labor market note that both in Kazakhstan and in the EU there is still a large number of young people not involved in labor activity, education or vocational training, i.e., belonging to the NEET category.
Consequences of «scarring» of the effects of youth staying in the NEET category in the long term negatively affect not only both directions and rates of development of any national economy, but also life trends of young people themselves, manifesting through a reduction in potential income throughout life, an increase in the risk of unstable employment and job losses, as well as the risks of such social pathologies as deterioration of health and psycho-emotional state, a tendency to antisocial behavior, a decrease in the birth rate, etc. (Youth unemployment: current trends and consequences, 2017). A number of foreign studies indicate that young people who find themselves in the NEET category later experience its residual «scar» effects on their further working career and material well-being, which reduces their adaptability and chances of survival in a dynamically developing labor market. In this vein, long-term NEET status increases the risks of future failures in the labor market and low wages even after 5–10 years (Crawford et al., 2010). European studies provide the following empirical data:
- Every three months of unemployment a young man under the age of 23 faces can further lead to an additional 1.3 months of unemployment at the age of 28–33;
- One year of unemployment in youth can reduce the annual earnings at the age of 42 to 21 % (OECD/European Commission. Policy Brief on Youth Entrepreneurship, 2012).
In addition, after 10 years a young man unemployed for years at the age of up to 23 will be paid 23 % less than that of its peers (for women, the gap is 16 %), and less than 16 % after 20 years (The jobless young, 2011).
The European Foundation for the Improvement of Living and Working Conditions acting within the EU framework has detailed the NEET group highlighting its several categories (Eurofound, 2012). This is necessary to develop special measures for working and reducing the NEET youth segment. The main categories of NEET youth are as follows:
- Young people in a state of classic unemployment: they do not have a job, but are actively looking for it and are ready to start any moment;
- Young people unemployed because of caring for family members (e.g., young mothers) and young people with health restrictions;
- Inactive young people not seeking employment and not burdened by anything and without health issues;
- Inactive young people who lead an antisocial and dangerous lifestyle;
- Young people actively seeking employment or training, but focused only on those vacancies and/or opportunities that, in their opinion, correspond to their skills and status;
- Young people who have made an informed choice in favor of travel and are constantly involved in such activities as art, music and self-education (Europe 2020: Employment Policies European Employment Strategy, 2002).
In addition to these features, we feel important to also note generational differences to identify additional authentic measures for the reduction of NEET youth number. Accordingly, analysts of this issue distinguish the following:
- The new generation of young people (Generation Z) is characterized by a high degree of realism, actualization of their own position;
- A neutral attitude to work: a clear separation of personal private life and professional activity (Goliusova, 2017);
- Focus on an innovative work style that leads to new products and technologies;
- Focus on leisure and quick satisfaction of their needs (Williams, 2015);
- A high level of digital presentation of their lives (e.g., digital natives effect and Instagram effect).
The same features are inherent in the part of this generation characterized as NEET youth. Therefore, in the issue of reducing this category of young people it is necessary to keep in mind these generational requests. In view of this, the problem of modernization of higher education, the emergence of productive employment in the youth labor market and the growth of the inclusiveness of the environment is being actualized as well.
Ignoring the phenomenon and the state of NEET youth can lead to the preservation of stable stagnant unemployment in the future, which increases both social and macroeconomic issues. Since today the NEET youth segment is increasing, it is necessary to develop a comprehensive model of its reduction based on convergence of three components: productive employment (to form the motivation of NEET youth to work); post-industrial education (to acquire professional skills in information environment and globalizing context of their appliance); and inclusive development (as a constant of modern socialization of the economy.)
Complementary Data: This research is funded by the Science Committee of the Ministry of Education and Science of the Republic of Kazakhstan (Grant No. AP09259065).
- Alfieri S. et al. (2015) Young Italian NEETs (Not in Employment, Education, or Training) and the Influence of their Family Background. Europe’s Journal of Psychology, 11, 2, 311–322.
- Bridging the gap: New opportunities for 16–18 year olds not in education, employment or training. Report by the Social Exclusion Unit. July 1999. Retrieved from: http://dera.ioe.ac.uk/15119/2/bridging-the-gap.pdf
- Bynner J. et al. (2000) Obstacles and Opportunities on the Route to Adulthood: Evidence from Rural and Urban Britain. London, United Kingdom: Smith Institute.
- Bynner J., Parsons S. (2002) Social Exclusion and the Transition from School to Work: The Case of Young People Not in Education, Employment, or Training (NEET). Journal of Vocational Behavior, 60,289–309. — Doi:10.1006/jvbe.2001.1868
- Biuro natsionalnoi statistiki Agentstva po strategicheskomu planirovaniiu i reformam Respubliki Kazakhstan. Dolia molodezhi — NEET (15–28 let) v Respublike Kazakhstan [Bureau of National Statistics of the Agency for Strategic Planning and Reforms of the Republic of Kazakhstan. The share of young people — NEET (15–28 years old) in the Republic of Kazakhstan.]. stat.gov.kz. Retrieved from: https://stat.gov.kz/official/industry/25/statistic/7 [in Russian].
- Carcillo S. et al. (2015) NEET Youth in the Aftermath of the Crisis: Challenges and Policies. OECD Social, Employment and Migration Working Papers.Paris: OECD Publishing. DOI: http://dx.doi.org/10.1787/5js6363503f6-en
- Chen Y.-W. (2009) Once ’NEET’, Always ‘NEET’? Experiences of Employment and Unemployment of Youth Participating in a Job Training Program in Taiwan. The 2009 Singapore Conference Materials: Asian Social Protection in Comparative Perspective. National University of Singapore, Singapore
- Cockx B., Picchio M. (2011) Scarring Effects of Remaining Unemployed for Long-Term Unemployed School-Leavers. CESifo Working Papers
- Coles B. et al. (2002) Literature Review of the Costs of being ‘Not in Education, Employment or Training’ at Age 16– 18. Research Report no 347. Nottingham: Department of Education and Skills.
- Crawford C. et al. (2010) Young People’s Education and Labour Market Choices Aged 16/17 to 18/19. Research Report. Department of Education. DFE-RR182. — https://www.gov.uk/
- Crawford C. et al. (2010) Young People’s Education and Labour Market Choices Aged 16/17 to 18/19. Research Report. Department of Education. DFE-RR182. Retrieved from: https://www.gov.uk/government/uploads/system/uploads/attachment_data/file/183355/DFE-RR182.pdf
- DeSilver D. (2016). Millions of Young People in U.S. and EU Are Neither Working Nor Learning. Pew Research Center, Retrieved from: (http://www.pewresearch.org/fact-tank/2016/01/28/us-eu-neet-population)
- Generation Z will ruin businesses that fail to adopt new ways of working // ITWeb. Retrieved from: https://www.itweb.co.za/content/XGxwQD71ebV7lPVo
- Gladwell D. et al. (2016). A Dynamic Analysis of Skill Formation and NEET Status. Sheffield Economic Research Paper Series. SERPS no 2015016. The University of Sheffield. Retrieved from: https://www.sheffield.ac.uk/ polopoly_fs/1.471636!/file/serps_2015016.pdf
- Goliusova, Yu.V. (2017). Formirovanie gruppy NEET-molodezhi v sovremennom mire. Transformatsiia chelovecheskogo potentsiala v kontekste stoletiia [Formation of the NEET-youth group in the modern world / / Transformation of human potential in the context of the century]. Pod obshchei redaktsiei professora Z.H. Saralievoi — Under the general editorship. Prof. Z. H. Saralieva, 2 (1), S. 249–252 [in Russian].
- Gregg P., Tominey E. (2005) The Wage Scar from Male Youth Unemployment. Labour Economics,12, 4, 487–509
- Heckman J., Carneiro P. (2003). Human Capital Policy: NBER Working Paper Series. № 9495. Retrieved from: http://www.nber.org/papers/w9495.pdf.
- International Labour Office (2013).Decent work indicators: guidelines for producers and users of statistical and legal framework indicators: ILO manual: second version / International Labour Office. — Geneva: ILO, 2013. Retrieved from: https://www.ilo.org/wcmsp5/groups/public/—-dgreports/—-stat/documents/publication/wcms_223121.pdf
- International Labour Organization (2017). Report of International Labour Organization «Global Employment Trends for Youth 2017: Paths to a better working future». Retrieved from: http://www.ilo.org/global/publications/books/global-employment-trends/WCMS_598669/lang—en/index.htm
- Inui A. (2005). Why Freeter and NEET Are Misunderstood: Recognizing the New Precarious Conditions of Japanese Youth. Social Work and Society, 3, 244–251.
- Kelly E., McGuinness S. (2013) The Impact of the Recession on the Structure and Labour Market Success of Young NEET Individuals in Ireland. ESRI Working Papers. Working Paper no 465.
- Khabar (2019). K. Tokaev zakryl God molodezhi i dal start Godu volonterov [K. Tokayev closed the Year of Youth and launched the Year of Volunteers]. https://khabar.kz/ru Retrieved from: https://khabar.kz/ru/news/item/117899-k- tokaev-zakryl-god-molodezhi-i-dal-start-godu-volonterov [in Russian].
- Molodezhnaia bezrabotitsa: sovremennye trendy i posledstviia / Assotsiatsiia «Tsentr issledovanii ekonomicheskogo i sotsiokulturnogo razvitiia stran SNG, Tsentralnoi i Vostochnoi Evropy». [Youth unemployment: current trends and consequences /Association « Center for Research on Economic and Socio-Cultural Development of the CIS countries, Central and Eastern Europe]. Retrieved from: http://www.ng.ru/stsenarii/2017–04– 25/10_6981_unemployment.html [in Russian].
- NEETs. Young people not in employment, education or training: Characteristics, costs and policy responses in Europe. Eurofound. Publications Office of the European Union, Luxembourg, Retrieved from: https://www.eurofound.europa.eu/sites/default/files/ef_publication/field_ef_document/ef125 4en.pdf
- OECD/European Commission. (2012). Policy Brief on Youth Entrepreneurship — Entrepreneurial Activities in Europe. Luxembourg: Publications Office of the European Union, 23 Retrieved from: http://www.oecd.org/cfe/leed
- Samoilenko A., Carter K. (2015) Economic Outcomes of Youth Not in Education, Employment or Training (NEET): New Zealand Treasury Working Paper 15/01. March 2015. — Retrieved from: http://www.treasury.govt.nz/publications/research-policy/wp/2015/15–01.
- Sotsiologicheskii portret molodezhi NEET v Kazakhstane (2019). [Sociological portrait of NEET youth in Kazakhstan]. Nur-Sultan: NRC «Molodezh», 188 [in Russian].
- Solon G. A (2004). Model of Intergenerational Mobility Variation over Time and Place // Miles Corak (ed.) Generational Income Mobility in Europe and North America. Cambridge University Press, 38–47.
- Statistics on young people neither in employment nor in education or training of the European Union (2021). Retrieved from: URL: https://ec.europa.eu/eurostat/statistics-explained/index.php? title=Statistics_on_young_people_neither _in_employment_nor_in_education_or_training#The_transition_from_education_to_work
- The jobless young. Left behind. (2012). URL: https://www.economist.com/briefing/2011/09/10/left-behind
- Varshavskaya, E.Ya. (2015). Molodezh, iskliuchennaia iz sfery zaniatosti i obrazovaniia, v stranakh ES i Rossii [Youth excluded from employment and education in the EU and Russia]. Voprosy statistiki — Questions of statistics 4, 40– 47 [in Russian].
- Wadsworth J. (2013) Youth and The UK Labour Market. Growing up in Recession Britain. A MISOC event presenting new research. Presentation materials.
- Williams A. Move Over, Millennials. (2015). Here Comes Generation Z // The New York Times. Retrieved from: https://www.nytimes.com/2015/09/20/fashion/move-over-millennials-here-comes-generation-z.html
- Youth neither in employment nor education and training (NEET).(2002). Presentation of data for the 27 Member States. European Commission DG Employment, Social Affairs and Inclusion. Europe 2020: Employment Policies European Employment Strategy. — Brussels, 16 p. Retrieved from: ec.europa.eu/social/BlobServlet?docId=6602 &langId=en
- Yuji G. (2005).The NEET Problem in Japan. Social Science Japan,32, 3–4.