In the steppe zone, the high sensitivity of plant cover to humidity contrasts raises the question of what landscape conditions provide a stable predictable phytoproductivity. Authors of the article tested the hypothesis about the inequality of the spatial factors of variability of functioning under the conditions of the reserved regime and anthropogenic impact on the example of the Aytuarskaya steppe. Based on the deviations of the intra-seasonal increments of the normalized difference vegetation index (NDVI) for 33 pairs of terms from the mean values, the measure of instability of the types of dynamics of green phytomass (Shannon's index) was calculated. To identify the clusters of high and low phytoproductivity, the Hot Spot Analysis was applied based on Getis–Ord statistics. On grazed areas, the background type of dynamics of green phytomass is not dominant in area in contrast to protected areas. The reserve regime stabilizes the dynamics of phytomass due to a higher subordination to landscape-scale processes. Summer loss of phytomass outside the reserve occurs over a larger relative area than in the reserve. Zones of the most unstable phyto-production functioning with high variability of the shape of spots of increased phytomass are characteristic of catchment depressions, lower parts of slopes, and narrowed sectors of gullies.
Introduction
The current trend in landscape research involves supplementing the structural characteristics with functional ones while delineating natural complexes. In the steppe zone, with its almost ubiquitous plowing, the high sensitivity of the vegetation cover to humidification contrasts the question of what landscape conditions provide a stable predictable phytoproductivity is critical. From the point of view of environmental planning, the spatial structure is easier to describe than the time series of functioning. Hence, the question of the relationship between the spatial structure and the variability of functioning modes is the question of the predictability of the consequences of external influences, including anthropogenic loads.
Considerable experience has been obtained in compiling dynamic portraits of phytocoenoses types based on the inter-annual variability of the normalized difference vegetation index (NDVI) [1, 2]. The researchers established the dependence of the total aboveground phytomass production in plant communities of the arid zone on soil moisture, in protected areas particularly. Changing the reserve regime for economic use and vice versa, as a rule, induces changes in the course of phytomass production. A significant part of such studies is devoted to the dynamics of the phytomass in pastures [3, 4]. In degraded communities, the relationship between changes in herbage productivity and soil moisture is not always unambiguous, which is most often associated with the introduction of species resistant to soil drought into degraded communities [5]. Most remote sensing studies of phytoproductivity focus either on directed changes in the vegetation cover associated with climatic changes or fires [6], or on spatial patterns that exert control over trends in productivity changes under the anthropogenic impact [7]. One of the problems in the analysis of time series is the influence of inter-annual phenological shifts in the development of vegetation. Therefore, to ensure the comparability of information for different years not direct NDVI values are used, but their deviations from the mean long-term value [1].
Understanding the regularities of the spatial and temporal organization of the phytomass dynamics and the range of possible states for each specific area of the landscape will reduce the risks of both agriculture and animal husbandry associated with fluctuations in phytomass production. The goal of the study is to determine the spatial differences in the variability of the types of intraseasonal dynamics and the spatial mosaicity of phytoproductivity in protected and pasture low-mountain-steppe landscapes.
Experimental
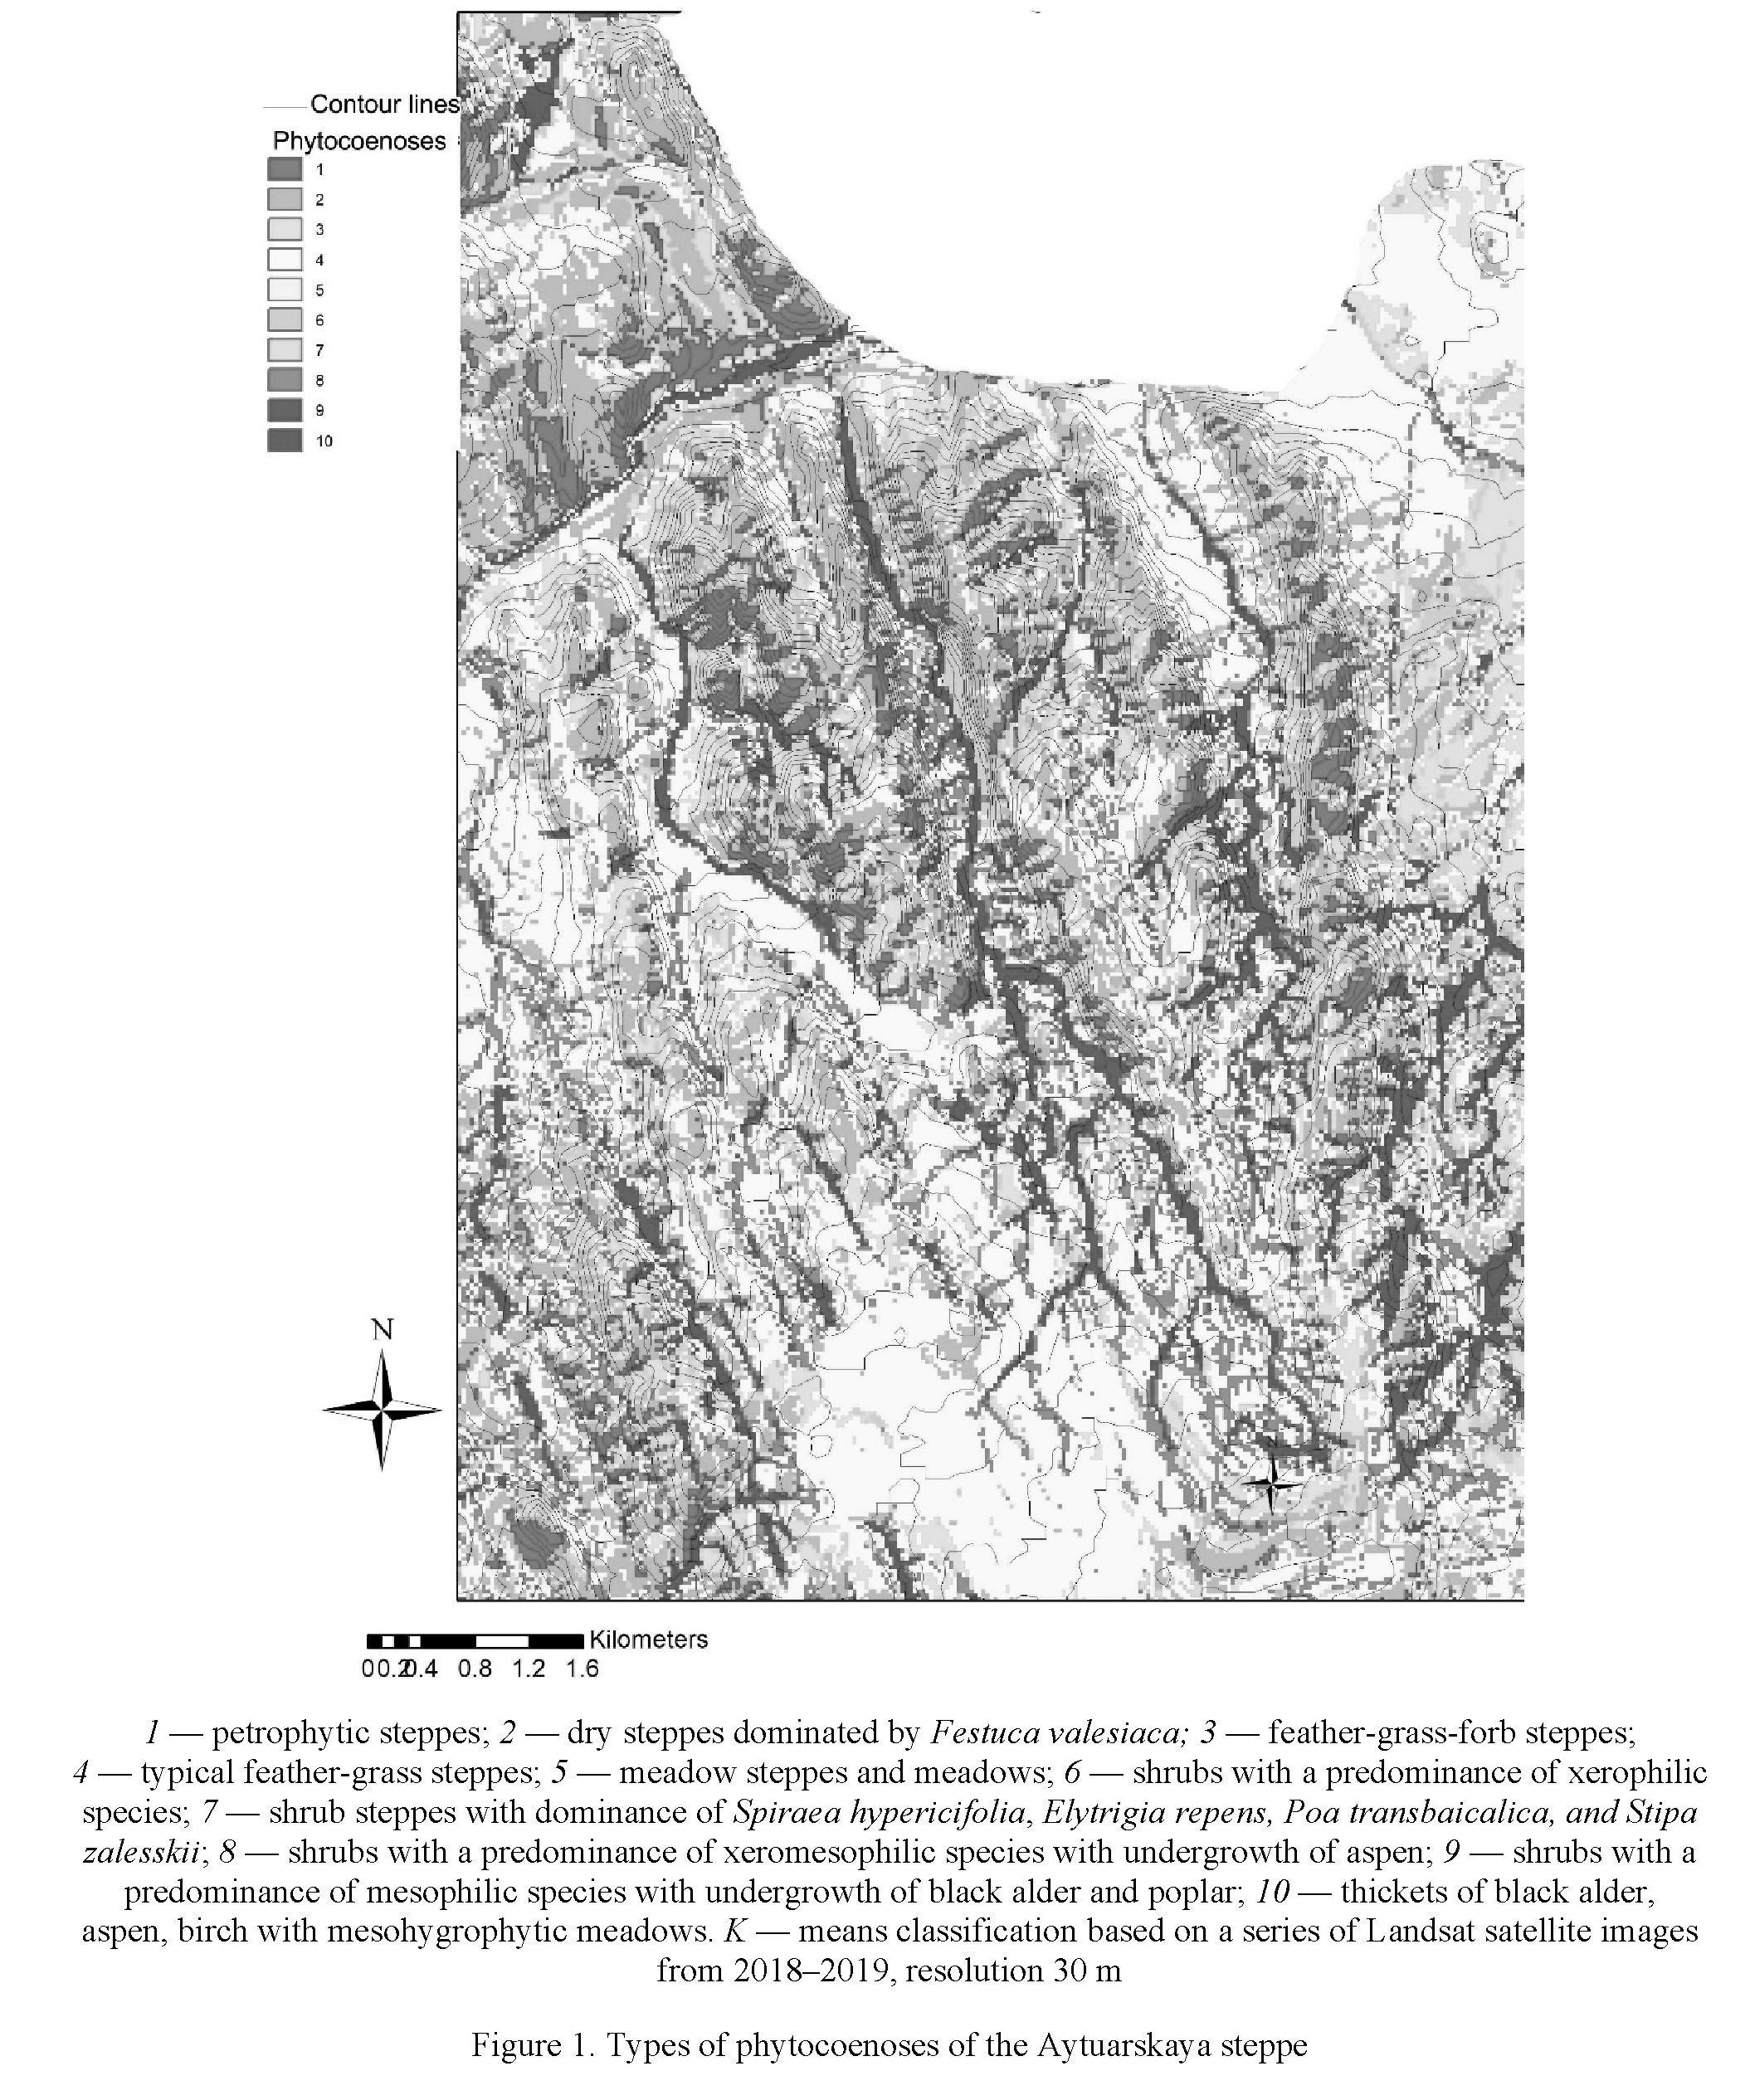
The territory is located within the Alimbet-Kargalinsky physical-geographical region of the Sarinsko- Guberlinsky district of the Ural-Tanalyk province [8] near the confluence of the Aytuar river in the Ural river (center — 51°05´N 57°40´E). Most territory (except for the north-western section) belongs to the Orenburg State Nature Reserve. The characteristic alternation of protrusions of different layers on the ridges and slopes creates a high facies mosaicity of steppe communities. They differ in lithomorphism ranging from Stipa zalesskii (species names are given according to [9]) dominated steppes on well-developed chernozems on the plateau up to Elytrigia pruinifera dominated petrophytic communities on the petrozems of steep rocky slopes. In the hollows and the bottoms of the gullies, one can observe xeromesophytic variants of the steppes (Poa transbaicalica, Stipa pulcherrima, various forbs), shrub thickets (Amygdalus nana, Cerasus fruticosa, Caragana frutex, Spiraea hypericifolia) or coppices of black alder, aspen, birch on hydrometamorphized chernozems. In the 1980–1990s, according to local residents, up to 30 thousand heads of goats were grazed. By 2010 no more than 200 heads, mainly sheep, were grazed north of the village Aytuar.
To explain the spatial differences in the variability of the phytoproduction process, we classified the Landsat 8 multichannel satellite image using the k-means method and distinguished 10 types of phytocoenoses (Fig. 1). Field verification was performed in June 2019. The territory was provided with 216 landscape descriptions in 2011–2019.
NDVI values were calculated in SAGA GIS software based on 33 Landsat images from 1984–2019. For each of the 80,860 pixels, the following calculations were conducted:
- Difference in NDVI values between survey dates during one growing season (increment with a positive or negative sign). Totally 38 pairs of dates were processed.
- Average (background) increment of NDVI over the landscape for each pair of dates. The hypothesis of a normal distribution of increments, or at least the presence of a modal interval near the mean, was tested. For all pairs of dates, the second case was confirmed.
- A measure of the deviation of the increment from the mean over the landscape (in units of standard deviation) for each pair of dates. For each pixel, we checked whether it had a modal increment of NDVI (deviation from the mean value no more than 0.5 standard deviation (STD) or deviates from it in the interval of 0.5–1.5 STD or more than 1.5 STD in positive or negative direction.
According to the results, for a given pair of date search pixel was assigned one of five “deviation classes”, below referred to as the types of green phytomass dynamics. Dynamics types 1 and 2 correspond to the strategy of rapid accumulation of phytomass in spring and small losses in summer (STD<–1.5 and –1.5<STD<–0.5, respectively). Type 1 corresponds to the preservation of almost all late spring — early summer phytomass. Dynamics type 3 (–0.5<STD<0.5) corresponds to a background mode of intraseasonal change for the landscape. This means a moderate loss of phytomass in the second half of summer. Types 4 and 5 (0.5<STD<1.5 and STD>1.5, respectively) correspond to a slow accumulation of phytomass in spring and a strong loss in summer, in comparison, respectively, with background and high values in late spring — early summer. Then, for each pixel, the following procedure was carried out: 1) calculation of the probability of each gradation (type of dynamics); 2) calculation of the measure of uncertainty (i. e. instability) of the dynamics of NDVI (H) according to the Shannon’s formula. We tested the hypotheses that the measure of the dynamics instability depended on the phytomass itself and this dependence varied over the seasons. We calculated Spearman's correlation coefficient between the NDVI values for each period and the values of the uncertainty measure by means of the Statistica 7.0 software.
To identify the locations of clusters of high and low values of phytomass, we applied the Hot Spots Analysis (in GIS ArcMap 3.0) based on the calculation of Getys-Ord statistics for a neighborhood with a radius of 300 m. In each pixel, for each of 38 pairs of dates, we evaluated the statistical significance of the NDVI difference from the neighborhood. Clusters of increased phytomass are below referred to as hot spots (HS), clusters of decreased phytomass — as cold spots (CS). In the last decade, the method has been increasingly used to explain the reasons for the mosaic nature of agricultural productivity, the emergence of urban heat islands, fires, etc. [10]. The morphometric parameters of the relief were calculated in GIS SAGA 7.0 from a digital elevation model with a resolution of 30 m.
Results and Discussion
The map of the prevailing types of intra-seasonal dynamics of phytomass (Fig. 2) shows their uneven spatial distribution and sensitivity to the landscape pattern.
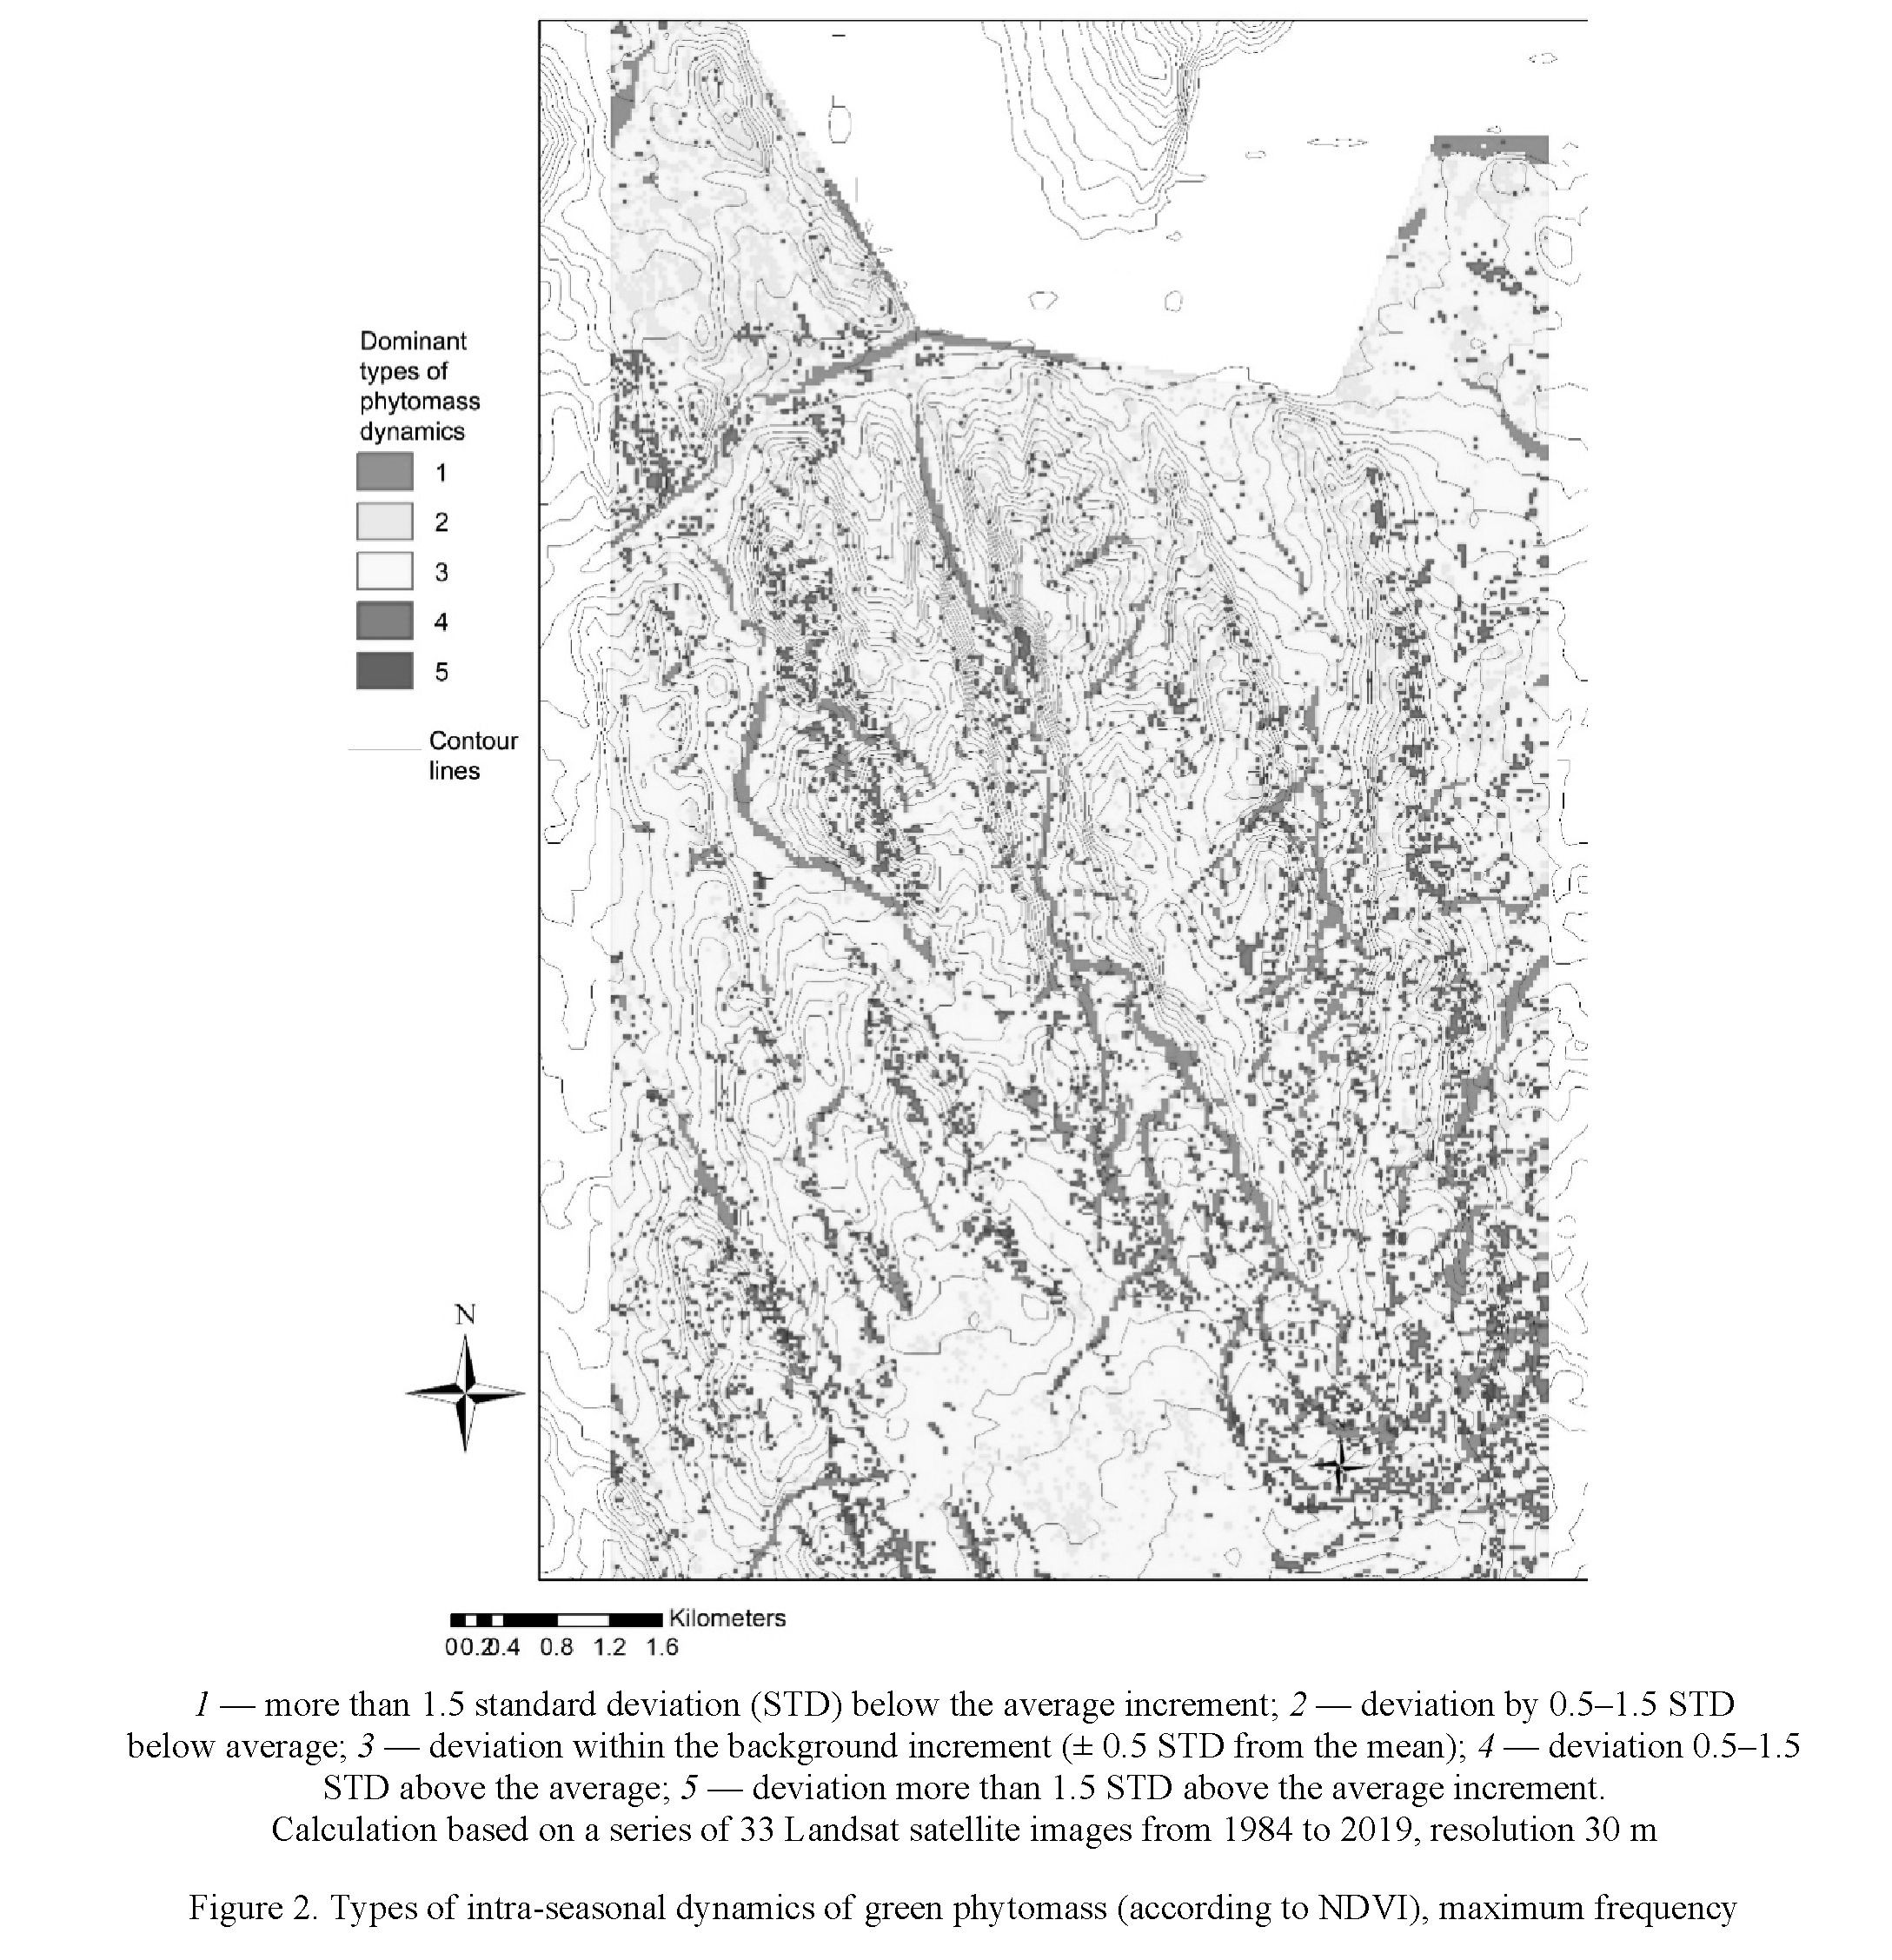
175
Concave landforms are the most clearly distinguished by high probability of the dynamics type 1. Convex landforms are indicated by domination of the dynamics type 4. It is worth noting that in the grazed areas (northwestern part), the variety of types of dynamics is reduced, in comparison with the protected central and southern parts of the landscape. In contrast to the reserve, the background type of dynamics 3 is not dominant in the pastures, and can be supplanted by the type 2.
The reserve regime in zonal steppe phytocoenoses stabilizes the dynamics of green phytomass due to the higher frequency of background dynamics (type 3), i. e. subordination to landscape-scale processes. This is interpreted as a uniform mode of functioning inherent in a holistic geosystem. Production of phytomass in spring with the possibility of its preservation or renewal by the end of summer (types 1–2) in grazed areas occurs with a higher frequency than in the nature reserve. This strategy is inherent for shrub communities (commonly, in concave landforms) which often expand at the expense of steppe communities due to grazing. In the most intensively grazed sector, where petrophytic steppes and communities with domination of Festuca valesiaca prevail, dynamics with partial preservation of spring phytomass (type 2) is the most typical. This indicates a rather high degree of pasture digression with the predominance of drought-resistant species ignored by sheep and cattle. At the same time, type 2 of dynamics can be dominant in pastures while type 1 — only within a deeply incised small valleys with riparian forests in the northeastern corner and on the floodplains of the Aytuar and Ural rivers. In the reserve, type 1 dynamics is manifested not only along streams, but also in numerous gullies and drainage depressions.
The maximum positive Spearman's correlation (0.3–0.4) between the NDVI values and the H values was revealed in July and August. This dependence almost disappears in April and May. In other words, the maximum instability of phytomass dynamics (H=1.17–1.26) is characteristic of those landscape units that are able to maintain the maximum phytomass in dry hot summer months, i.e. gullies and floodplains. Basically, these are areas with the maximum occurrence of the 1st type of dynamics (30–40 %). A positive but weaker, correlation persists in autumn.
The most productive communities on pastures (besides riparian forests) are steppes with dominance of Stipa zalesskii, Poa transbaicalica, Elytrygia repens, Spirea hypericifolia, and various forbs occupying gullies and the most concave parts of the valley bottoms. In the reserve, higher abundance of Poacea species favours elevated probability of 3rd and 4th types of phytomass dynamics. This results in decrease of average measure of instability H which accounts for 1.11 versus 1.19 on pastures. On pastures, types of dynamics 1 and 2 occur more often (Table 1), since the bulk is made up of non-food shrubs while most grasses and forbs are grazed. A similar pattern is characteristic of phytocenoses dominated by Scorzonera austriaca, Poa transbaicalica, Festuca valesiaca on pastures, which is confirmed in the literature [11], as well as of typical Stipa — dominated steppes (Tab. 1).
Table 1
Median frequency of phytomass dynamics types (1–5) and measures of instability of phytomass dynamics types (H)
|
Phytomass dynamics types (1–5) and instability measure H |
Petrophytic steppes |
Stipa zalesskii and Festuca valesiaca dominated steppes |
Stipa zalesskii dominated steppes |
Shrubby steppes with dominance of Spiraea hypericifolia |
||||
|
Reserve |
Pasture |
Reserve |
Pasture |
Reserve |
Pasture |
Reserve |
Pasture |
|
|
H |
1.35 |
1.43 |
1.19 |
1.28 |
0.98 |
1.16 |
1.04 |
1.11 |
|
1 |
0.03 |
0.06 |
0.00 |
0.03 |
0.00 |
0.03 |
0.00 |
0.03 |
|
2 |
0.27 |
0.30 |
0.24 |
0.36 |
0.15 |
0.27 |
0.15 |
0.24 |
|
3 |
0.39 |
0.30 |
0.42 |
0.33 |
0.57 |
0.45 |
0.51 |
0.51 |
|
4 |
0.28 |
0.24 |
0.27 |
0.27 |
0.21 |
0.21 |
0.27 |
0.15 |
|
5 |
0.03 |
0.06 |
0.00 |
0.00 |
0.00 |
0.00 |
0.03 |
0.00 |
In this case, the increased frequency of the strategy of maintaining the phytomass (usually characteristic of less xerophytic communities) in pastures is explained by its initially low phytomass in the beginning of grazing in early spring. High grazing loads in the 1980s favored the same mode of phytomass dynamics. In addition, the phytomass in the petrophytic steppes is preserved slightly better in summer than in areas with the background dynamics. This is associated with the predominance of poorly eaten drought-resistant species. In the reserve, a similar regime is typical for narrow watershed ridges and steep west-facing slopes. Thus, the summer loss of phytomass outside the reserve occurs over a larger relative area than in the reserve. The instability of the phytomass dynamics (H) for all types of phytocenoses is lower in the reserve, which proves the stabilizing role of the reserve regime. Hence, the absence of anthropogenic disturbance reduces the contribution of local factors to the variation of phytomass but increase the dependence on landscape-scale factors.
The Hot Spots Analysis showed evidence that seasonal dynamics of patches of increased and decreased green phytomass (HS and CS, respectively) clearly differs in the protected and grazed areas. Within the reserve, the total area and the number of emerging CSs are greater than on pastures to the north of Aytuar village. The main differences in the seasonal dynamics of HS and CS are manifested in spring and autumn. In the second half of April, the only HS corresponds to the most strongly grazed site near the northern outskirts of the village. In the first decade of May, patches of increased phytomass begin to form on gently sloping pasture areas to the north of the reserve. By mid-May, HS in the pasture shrinks and disappears. In
177
the 1980s-1990s by the end of the month, it used to be transformed into CS due to intensive grazing. However, since the 2010s this site has not differed from the background conditions due to decrease of pasture loads. In June-August, there was no fundamental difference in the formation of HS and CS in the reserve and on pastures. By the beginning of October, the total area and the number of emerging CSs within the reserve is greater than on pastures.
Comparison of the frequency of HSs in 1984–1998 and 2007–2019 illustrated that the establishment of the reserve regime resulted in significant changes in the functioning. The frequency of HSs along with the thalweg increased which is explained by restoration of tree and shrub thickets. On the pasture during this period, the decrease in loads caused a noticeable decrease in the occurrence and area of CSs. In fact, CS remains stable only along the main path of livestock movement from the village to the pastures. In the rest of the territory of pastures, the phytomass is distributed relatively evenly, which is partly explained by the compensating role of the phytomass of non-food species.
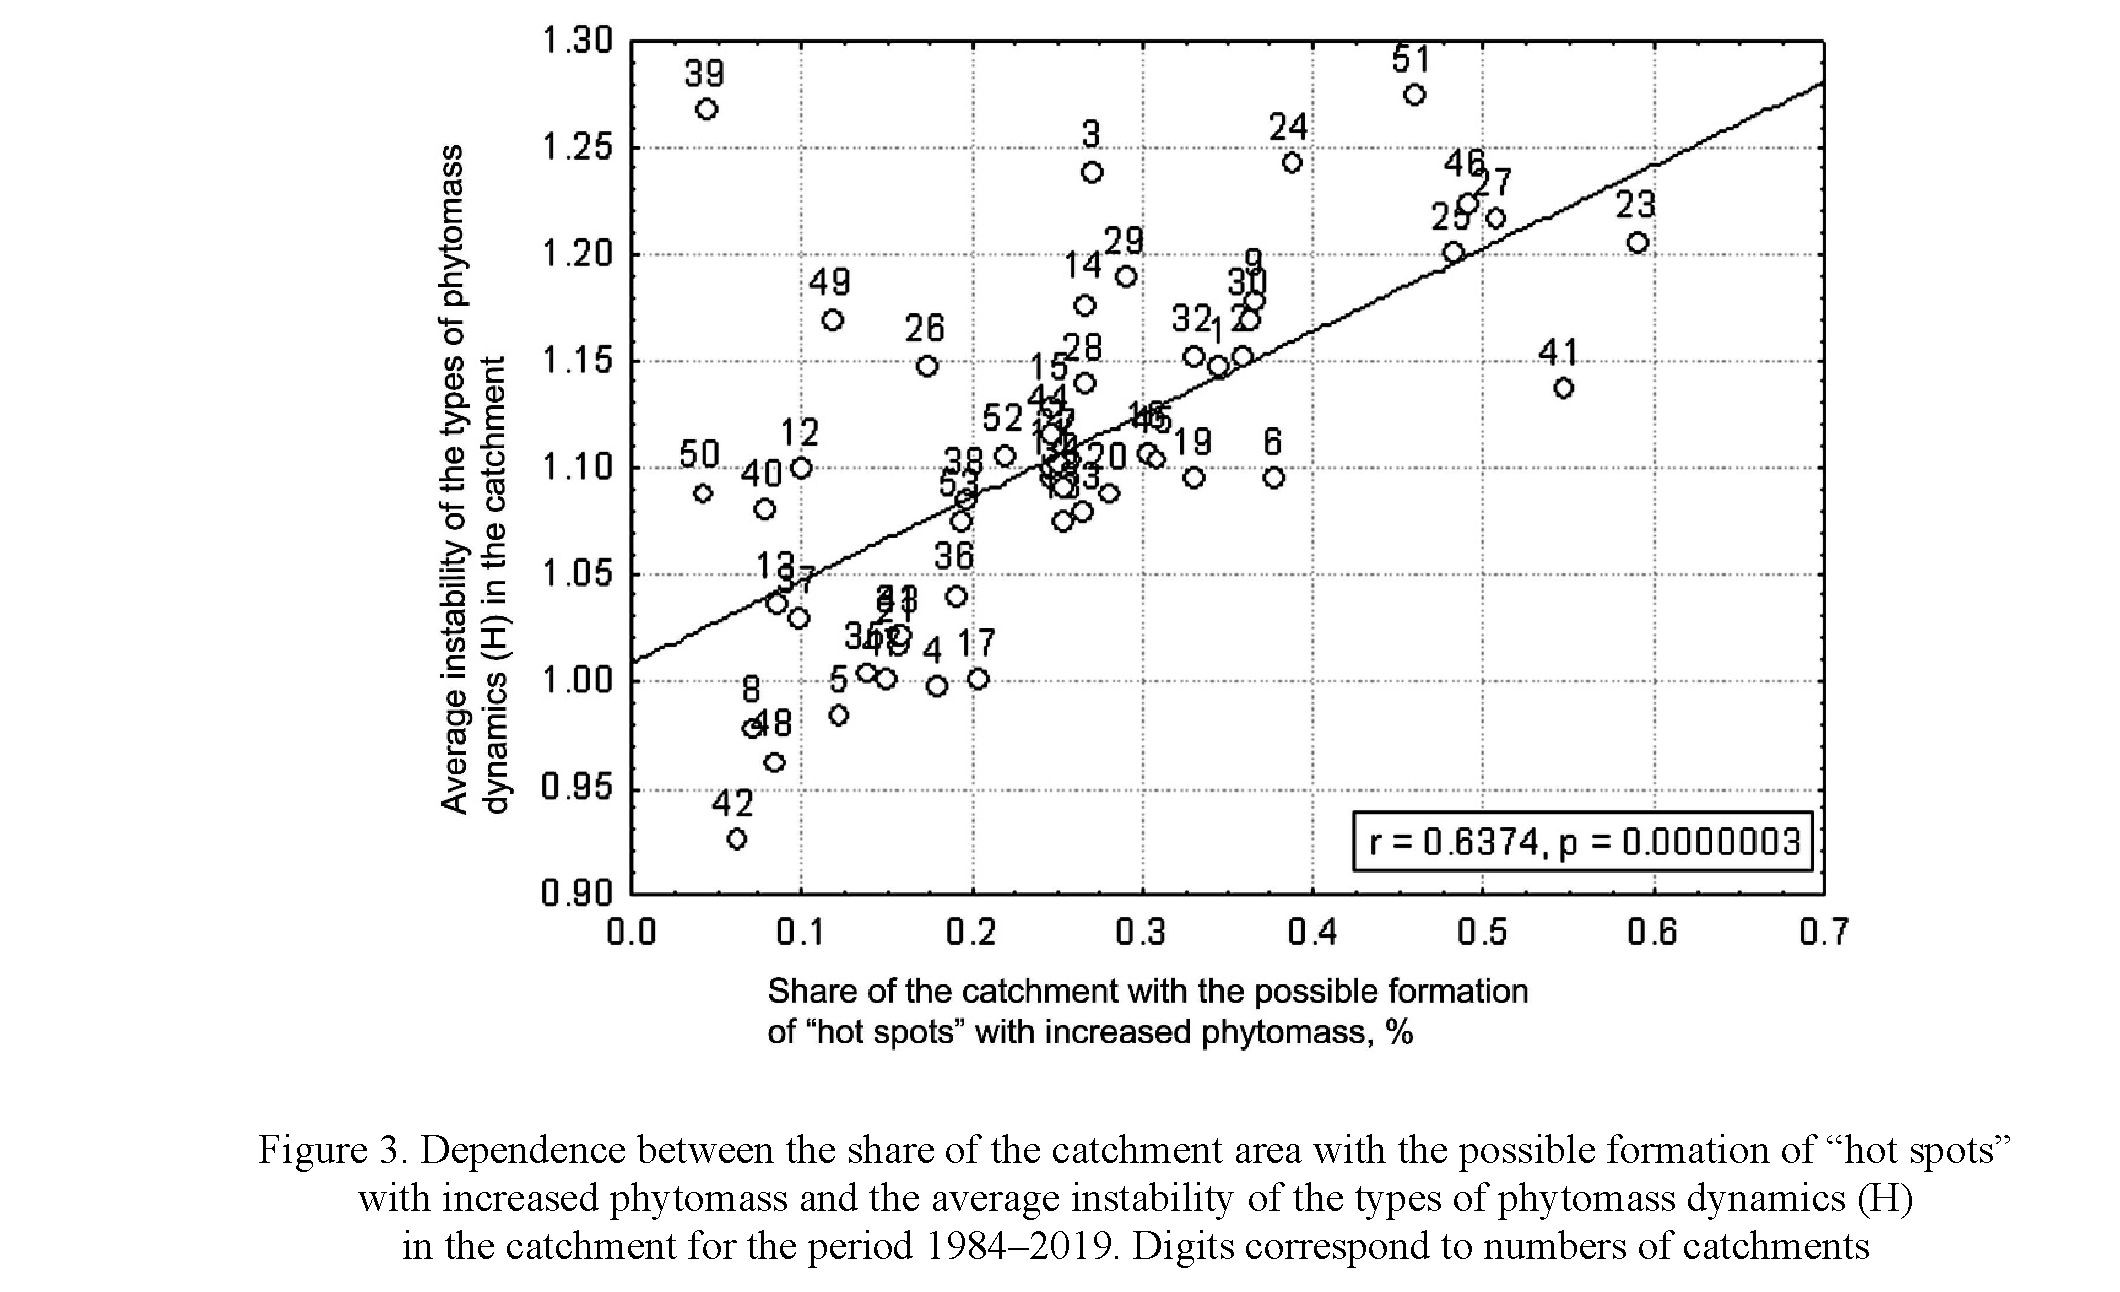
Now, we turn to the comparison of the spatial mosaicity of the phytomass and the characteristics of its variability over time. It is indicated by frequency of occurrence of spots of increased (HS) and decreased (CS) phytomass. The measure of instability of the intra-seasonal dynamics (H) indicates variability of phytomass. As a spatial unit, we took the drainage basin, for which descriptive statistics of these indicators were calculated.
The direct relationship between the average H over the catchment area and the fraction of the area with ever emerging HS (Fig. 3) designates that spots of increased phytoproductivity, as a rule, do not obey the background intra-seasonal dynamics (type 3). A high proportion of the most frequently occurring HSs (with a frequency of more than 0.7) are characteristic of those watersheds in which the instability of intra-seasonal dynamics is high. The catchments 39 and 41 which are noticeably out of this rule (Fig. 3), are still subject to pasture loads, although incomparably less than in the 1980s. In catchment 39, even with a small fraction of HS, a high average instability of the dynamics of green phytomass is observed. In contrast, in catchment 41, the dynamics are somewhat more stable than expected with such a high proportion of HSs.
Although high instability H occurs with any frequency of occurrence of HSs, a group of pixels stands out with a combination of maximum instability of intra-seasonal dynamics and average (0.4–0.6) frequency of HS occurrence. In other words, these are territories with a combination of unstable difference from the surroundings and unstable intra-seasonal dynamics. They occupy 2 % of the territory. It is only in this range of the HS frequency that the instability of the dynamics Н is everywhere high and cannot be low (less than 0.8). These are areas in which the frequency of deviations from the background dynamics is maximal while development of HSs is instable. In other words, some strong local factors are manifested from time to time. Such pixels usually surround the area of permanent HSs along the thalwegs or occupy drainage depressions. They most often correspond to the 1st and 5th types of dynamics, especially in woody thickets and mesophytic shrubs.
According to the results of discriminant analysis, the convergence index and cross-sectional curvature make the greatest contribution among the morphometric parameters of the relief to the development of unstable phytocoenoses (the frequency of HSs 0.4–0.6, H more than 1.2), especially on slopes. This means that a periodically occurring increased inflow of moisture (gullies, narrowed parts of small valleys) causes the occurrence of HS, which does not exist permanently and often disappears. Such areas can be called strips of functional instability. They are confined to the lower part of the slope with an increased catchment area. The inflow of moisture into the lower part of the slope, causing the occurrence of HS, is an event of almost equiprobability, with no such event (i.e. to a frequency of about 0.5). In other words, from time to time, the activation of lateral moisture flows actually integrates the foot slope and the bottom of the erosional landform resulting in similarintensity of phytomass production.
The largest area of zones of functional instability (41 %) falls on mesophytic meadows and woody aspen-birch-black alder thickets, less (15 %) — on meadow steppes. Such zones are practically do not occur in dry and typical steppes, and rarely occur in phytocoenoses with xerophytic and mesoxerophytic shrubs.
Conclusions
In contrast to most studies of phytoproduction functioning, focused on the patterns of time series and their variations depending on lithogenic conditions, we identified spatial patterns of stability of functioning generated by radial and lateral connections. The proposed method makes it possible to clarify the degree of stability and sharpness of landscape boundaries by measures of instability of the types of dynamics and variability of the areas of “hot spots” of phytomass. In addition to the traditional criterion of homogeneity of the abiotic template, we applied the criterion of the integrity of the functioning mode. The following conclusions were obtained.
- The stability of the dynamics of green phytomass is always higher in the reserve than outside it. The conservation regime in typical steppes stabilizes the dependence of the dynamics of green phytomass on landscape-scale processes. Anthropogenic loads increase the dependence on local factors.
- Summer loss of phytomass outside the reserve occurs over a larger relative area than in the reserve. In the most arid conditions and under pasture loads, the phytomass in summer can hardly decrease due to the predominance of drought-resistant and poorly eaten species.
- Owing to the establishment of the reserve regime, the frequency of occurrence of spots of increased phytomass associated with tree and shrub thickets along the thalwegs has increased. On the pasture, the decrease in loads resulted in a noticeable decrease in the frequency of occurrence and the area of spots of low phytomass.
- The highest proportion of frequently occurring spots of increased phytomass is characteristic of catchments with maximum instability of intra-seasonal dynamics, with the exception of catchments with intense pasture loads.
- Zones of the most unstable phytoproductive functioning with high variability of the shape of patches with increased phytomass are characteristic of catchment depressions, lower parts of slopes, narrowed sectors of valleys.
Acknowledgements
The research was financially supported by the Russian Foundation for Basic Research (project 20–05– 00464).
References
- Bartalev, S.A., Elkina, E.S., Lupjan, E.A., Plotnikov, D.E., & Tolpin, V.A. (2017). Distantsionnaia otsenka ozimykh kultur urozhaia 2017 goda v Rossiiskoi Federatsii [Remote assessment of winter crops in 2017 in Russian Federation]. Sovremennye prob- lemy distantsionnogo zondirovaniia Zemli iz kosmosa — Current problems in remote sensing of the Earth from space, 14, 4, 275–280 [in Russian]. https://doi.org/10.21046/2070-7401-2017-14-4-275-280
- Fedorov, N.I., Zharkikh, T.L., Mikhailenko, O.I., Bakirova, R.T., & Martynenko, V.B. (2019). Forecast changes in the productivity of plant communities in the Pre-Urals Steppe site of Orenburg State Nature Reserve (Russia) in extreme drought conditions using NDVI. Nature Conservation Research, 4, 2, 104–110. https://dx.doi.org/10.24189/ncr.2019.044
- Zolotokrylin, A.N., Titkova, T.B., Ulanova, S.S., & Fedorova, N.L. (2013). Nazemnye i sputnikovye issledovaniia produk- tivnosti pastbishch Respubliki Kalmykii s razlichnoi stepeniu degradatsii rastitelnykh soobshchestv [Ground and satellite studies of the productivity of pastures in the Republic of Kalmykia with varying degrees of degradation of plant communities]. Aridnye ekosistemy — Arid ecosystems, 19, 4 (57), 31–39 [in Russian].
- Rahetlah, V.B., Salgado, P., Andrianarisoa, B., Tillard, E., Razafindrazaka, H., Le Mézo, L., & Ramalanjaona, V.L. (2014). Relationship between normalized difference vegetation index (NDVI) and forage biomass yield in the Vakinankaratra region, Madagascar. Livestock Research for Rural Development, 26 (5), 1–11.
- Danzhalova, E.V., & Hadbaatar, S. (2008). Produktivnost i otavnost rastitelnykh soobshchestv Vostochno-Aziatskogo sektora stepei v neblagopriiatnye po uvlazhneniiu gody [Productivity and aftermath of plant communities in the East Asian sector of the steppes in unfavorable years for moisture]. Aridnye ekosistemy — Arid ecosystems, 14 (35–36), 5–16 [in Russian].
- Gillespie, T.W., Ostermann-Kelm, S., Dong, C., Willis, K.S., Okin, G.S., & MacDonald, G.M. (2018). Monitoring changes of NDVI in protected areas of southern California. Ecological indicators, 88, 485–494. https://dx.doi.org/10.1016/ j.ecolind.2018.01.031
- Harris, A., Carr, A.S., & Dash, J. (2014). Remote sensing of vegetation cover dynamics and resilience across southern Africa. International Journal of Applied Earth Observation and Geoinformation, 28; 131–139. https://doi.org/10.1016/j/jag.2013.11.014
- Shakirov, A.V. (2011). Fiziko-geograficheskaia regionalizatsiia Urala [Physical-geographical regionalization of the Urals]. Ekaterinburg: Ural Branch of RAS [in Russian].
- Rjabinina, Z.N., & Knjazev, M.S. (2009). Opredelitel sosudistykh rastenii Orenburgskoi oblasti [Keys to vascular plants of the Orenburg region]. Moscow: KMK [in Russian].
- Meroni, M., Rembold, F., Urbano, F., Csak, G., Lemoine, G., Kerdiles, H., & Perez-Hoyoz, A. (2017). The warning classification scheme of ASAP — Anomaly hot Spots of Agricultural Production. Luxemburg: European Union. https://doi.org/10.2788/48782
- Safronova, I.N, Kalmykova, O.G, & Stepanova, N.Yu. (2020). Trans-Volga-Trans-Ural steppes of the northern subzone of the steppe zone: features of modern formational diversity. Arid ecosystems, 10, 4 (85), 3–8.