The article is devoted to assessing the contribution of greenhouse gas emissions from the transport sector of large cities and regional centers of the Republic of Kazakhstan. During the investigations we have calculated emissions from private automobiles in seventeen cities of Kazakhstan; declared the features of spatial differentiation of emissions by city districts; identified main factors of carbon intensity of motor transport in cities; determined quantitative indicators describing the significance of these factors, and provided an assessment of the significance of the considered factors. On the example of five representative cities (Nur-Sultan, Almaty, Shymkent, Ust-Kamenogorsk, Karaganda), the main spatial and geographical reasons for the decrease in the connectivity of the road network and the basic principles for reducing carbon intensity are identified. The studies are based on the data of the Committee on Statistics of the Republic of Kazakhstan, including statistical forms of the fuel and energy balance of the regions; demographic yearbooks; statistical collections containing information on the operation of transport; on the data of the open geoportals “Yandex Probki” and “Open Street Map”; on the results of GIS-calculations and on the methodological documents approved by IPCC.
Introduction
In the context of global climate change, the priority goal of sustainable development strategies for urban areas should be connected with reduction of carbon intensity, since cities occupy less than 1 % of the area, but more than 50 % of the world's population is concentrated on them [1]. At the same time, cities consume about 80 % of all produced energy in the world and emit about 75 % of greenhouse gases (GHG). Within the framework of international agreements in the field of climate change, most states, including the Republic of Kazakhstan (RK), have obligations to reduce GHG emissions. Kazakhstan is committed to reducing GHG emissions by 15 % (non-target) or 25 % (conditional target) by 2030 [2].
Actions aimed at reducing GHG emissions are called climate policy. In Kazakhstan, the goals and measures to reduce GHG emissions are fixed in such strategic planning documents as [3, 4], master plans of cities. Climate policy is often limited to measures to reduce GHG emissions from large power generating plants (CHP, GRES) and industrial facilities. Such objects are much easier to control, and to calculate with a high degree of certainty the potential effectiveness of climate policy measures.
However, measures to reduce GHG emissions through fuel and energy savings by end consumers can have an equally tangible effect. For example, in the regional centers of Kazakhstan, the share of GHG emissions associated with the operation of the public utilities (heating and power supply of residential buildings) and transport sectors varies from 30 % to 90 % of all urban emissions.
Measures to reduce the carbon intensity of the public utilities and transport sectors are being implemented as part of the climate strategies of many cities in Europe and the United States. For example, the London Development Plan [5] aims to reduce the city's GHG emissions through the implementation of measures in the utilities and transport sectors by 50–60 %, and the Chicago Climate Action Plan [6] — by 30–40 %.
In Kazakhstan, as also in most post-Soviet states, measures to reduce the contribution of end-users to the formation of GHG emissions are used rarely, mainly due to the low certainty of their effectiveness estimates. Factors that increase the uncertainty of such estimates include the following circumstances:
- A large number of scattered sources makes it difficult to inventory the characteristics of each of them and requires the use of methodological approaches that allow in a generalized form.
- Often, city governments do not have access to detailed information needed to be used as input data when calculating GHG emissions.
- The effectiveness of measures to reduce GHG emissions in the municipal and transport sectors of cities significantly depends on natural and geographical factors. Therefore, there are no “universal recipes” for applying measures. Often, a set of measures that is effective in one city may be completely inapplicable in another.
- The effectiveness of measures to reduce GHG emissions in the utilities and transport sectors largely depends on the willingness of the population to participate in the implementation of such measures.
In this article, we propose a set of methods that allow us to assess the potential contribution of the decarbonization of urban transport systems to the fulfillment of the national obligations of the Republic. The specified set of methods allows:
- To carry out an inventory of GHG emissions with a high degree of certainty of results in the absence of initial data;
- To assess the contribution of the transport sector to the GHG emissions of individual cities;
- To identify and evaluate the significance of spatial and geographical factors of carbon intensity;
- To provide recommendations on specific climate policy measures or the cities in different geographic conditions.
Experimental
Initial data used in the investigations
To calculate the total GHG emissions from the use of road transport in cities, statistical data of the Committee on Statistics of the Republic of Kazakhstan on the fuel and energy balance, demographic characteristics, features of road transport were used.
The assessment of the spatial distribution of GHG emissions from the transport sector was based on the data of the Yandex-traffic geoportal on the average speed of road traffic in the context of segments of the road network; database of average fuel consumption by cars depending on the speed of traffic, published in open Internet sources.
Research stages. The study described in this article consists of the following steps:
- Estimation of GHG emissions from private road transport of regional centers and large cities of Kazakhstan.
- Inventory of nonpoint sources of GHG emissions from vehicles and assessment of their spatial differentiation.
- Assessment of the significance of spatial and geographical factors of carbon intensity of motor transport in cities of Kazakhstan.
- Providing the recommendations on climate policy in transport sector of large cities.
Estimation of GHG emissions from private road transport of regional centers and large cities of Kazakhstan
The calculation of private vehicles GHG emissions in regional centers and large cities of Kazakhstan is based on the use of data published in the statistical form "Fuel and Energy Balance" of cities and regions of Kazakhstan. This form contains information on the amount of gasoline, diesel fuel, and gas supplied to consumers. Data on fuel consumption by cities are not provided for some regions, and only aggregated data for the region are published. In such cases, the hypothesis was accepted that the volume of fuel consumption in a settlement is directly proportional to the number of vehicles registered in it.
The calculation of total GHG emissions (carbon dioxide, methane, nitrous oxide) from the use of road transport was carried out according to the Guidelines for the calculation of greenhouse gas emissions from motor transport enterprises [7].
Inventory of nonpoint sources of GHG emissions from vehicles and assessment of their spatial differentiation
Studies describing the distribution of greenhouse gas emissions in certain parts of cities are the most valuable for planning actions to reduce GHG emissions, but they are labor-intensive to develop. A specific feature of GHG emissions from the transport sector is the predominance of nonpoint sources. Nonpoint sources include emissions of pollutants from individual and medium-scale formations, which, for practical reasons, cannot be considered as point sources of pollution in the inventory [8]. Many researchers [9–11] group diffuse sources based on their similarity and proximity to identify areas of activity that lead to the highest GHG emissions, as well as to identify areas where the implementation of climate change mitigation measures will be most effective. In the course of studying the spatial differentiation of emissions, nonpoint sources located within the same planning sector are combined [12]. As an alternative to using planning sectors in a city study, it is possible to calculate GHG emissions on a city block basis, use urban morphotypes as map units [13], or carry out calculations within the cells of a regular grid [14].
Based on the analysis of the experience of studying the spatial distribution of GHG emissions in cities, the most accurate studies should be considered based on the use of actual data on energy and fuel consumption. However, often (especially in small towns) the data needed to conduct such a detailed study are not available. Studies show [15] that comparable accuracy of results can be achieved using the downscaling method.
The proposed downscaling algorithm is based on the use of the estimated GHG emissions of the city as a whole to predict the emissions of planning sectors. When using this approach, the total amount of city emissions is distributed among planning sectors in proportion to the values of factors that increase energy or fuel consumption.
Required initial data:
1. The amount of consumed fuel (gasoline, diesel fuel, gas used to fuel vehicles). Data is published in the statistical collections "Fuel and Energy Balance" [Fuel... 2019].
2. Information on the length of the road network in the context of planning sectors — obtained from the data of the geoportal "Open Street Map" and used as a factor that determines the amount of GHG emissions from the transport sector in the context of planning sectors.
Calculation process:
The distribution of the total GHG emissions of cities by planning sectors, calculated according to the fuel and energy balance data, is carried out in proportion to the total mileage of cars within the planning sector (Formula 1).
Mplansec. =OOk * Mtot, (1)
Otot
where M plan.sec. — greenhouse gas emissions of the planning sector (tons); Mtot — total emissions of the city from the combustion of gasoline, diesel fuel and natural gas fuel when using transport (tons); Ok — total mileage of vehicles at the streets of the k-th planning sector (km); Otot — citywide mileage of vehicles (km).
The mileage of vehicles at the streets of the planning sector is determined as the sum of the products of the length of each segment of the street within the planning sector and the traffic intensity of this street (Formula 2):
Ok = (l*i), (2)
where L — the length of the segment of each street within the planning sector (km); I — traffic intensity on the street (vehicles per hour).
Using the described approach, an assessment was made of the spatial differentiation of emissions from regional centers and large cities of Kazakhstan.
Assessment of the significance of spatial and geographical factors of carbon intensity of motor transport in cities of Kazakhstan.
The main road transport the carbon intensity factors in large cities includes the structure of the vehicle fleet in terms of engine size; climatic features; connectivity of the road network. Table 1 describes the quantitative indicators used in assessing the significance of these spatial and geographical factors, and initial data.
Table 1
Main spatial and geographical factors of private road transport carbon intensity in large cities
|
Spatial and geographical factor of carbon intensity of private road transport in cities |
Quantitative value used in impact assessment |
The nature of impact |
Data sources |
|
1 |
2 |
3 |
4 |
|
Vehicle fleet structure by engine volume |
Percentage of vehicles with engine capacity over 3000 cm3 (3 liters) |
Cars with oversized engines consume more fuel and therefore emit more GHG. |
Committee on Statistics of the Republic of Kazakhstan; portal «kolesa.kz» |
|
Climatic features |
Time required to warm up the engine in the cold season of the year (hour) |
The share of fuel consumption and, consequently, GHG emissions associated with engine warm-up during the cold season can be up to 10 %. |
Research [16] |
Continuation of Table 1
|
1 |
2 |
3 |
4 |
|
Connectivity of the road network |
Non-connectivity index |
In the conditions of a disconnected street and road network, the average annual mileage of a car increases significantly. |
Own calculations on streetroad graphs OSM. |
Methods for calculating the share of vehicles with an engine volume of more than 3000 cm3. Information on the structure of the vehicle fleet in terms of engine size is published in the collections of the Committee on Statistics of the Republic of Kazakhstan only in a generalized form for the whole country. As an auxiliary source of information about the structure of the car fleet, the portal for car sales announcements "Kolesa.kz" was used. The study assumed that the ratio of cars of various categories on sale in a particular city corresponds to the ratio of all registered cars of these categories in the city under consideration. The validity of this assumption is confirmed by a high correlation coefficient (more than 0,7 [17]) between the structure of ads for sale and the structure of the vehicle fleet of the Republic of Kazakhstan as a whole.
Methods for assessing the influence of climatic conditions on the warm-up time of a car engine. Information about the average warm-up time of a car engine was obtained from research [17].
Methods for assessing the influence of road network parameters on carbon intensity. A characteristic that allows one to quantify the impact of the road network on the amount of GHG emissions from road transport can be considered the alpha index of road network connectivity. This index is the ratio of the number of contours observed on the graph of the considered road network to the maximum possible number of contours of the network with the number of nodes (crossings) equal to the considered road network. The alpha connectivity index is calculated by Formula 3:
K
α=K , (3)
max
where K — the number of contours in the considered network; Kmax — the maximum possible number of contours in the network;
In turn, K and Kmax are calculated by Formulas 4, 5:
K=L-(V-1); (4)
Kmax=3(V-2)-(V-1)=2V-5, (5)
where L — the number of connections at the road network; V — number of nodes at the road network.
Alpha connectivity index can take values from zero (for a completely disconnected network) to one (for a network with the maximum possible number of nodes). To illustrate the relationship between the connectivity of the road network and the amount of GHG emissions, the alpha connectivity index was converted to its inverse “Non-connectivity index” according to the formula:
i = 1 - α , (6)
where i — non-connectivity index.
Assessment of the significance of spatial and geographical factors of carbon intensity of motor transport in cities of Kazakhstan. As an indicator of the significance of the spatial and geographical factors of carbon intensity, the change in the volume of GHG emissions was used when the cities were brought to the similar best conditions in terms considered geographical factor with fixing the remaining parameters. Thus, to assess the significance of the structure of the vehicle fleet, a hypothetical situation was modeled, when in each city the share of high-volume engines becomes minimal, but climatic conditions and the connectivity of the road network are unchanged. To assess the significance of climatic conditions, a situation is modeled when in each city the time of the cold season and the warm-up time of the engine are minimal, while other spatial and geographical factors remain unchanged. In the course of assessing the significance of the connectivity of the road network, it is assumed that the average annual mileage of a car in each city corresponds to the conditions of the highest connectivity of the road network among the considered cities.
Results and Discussion
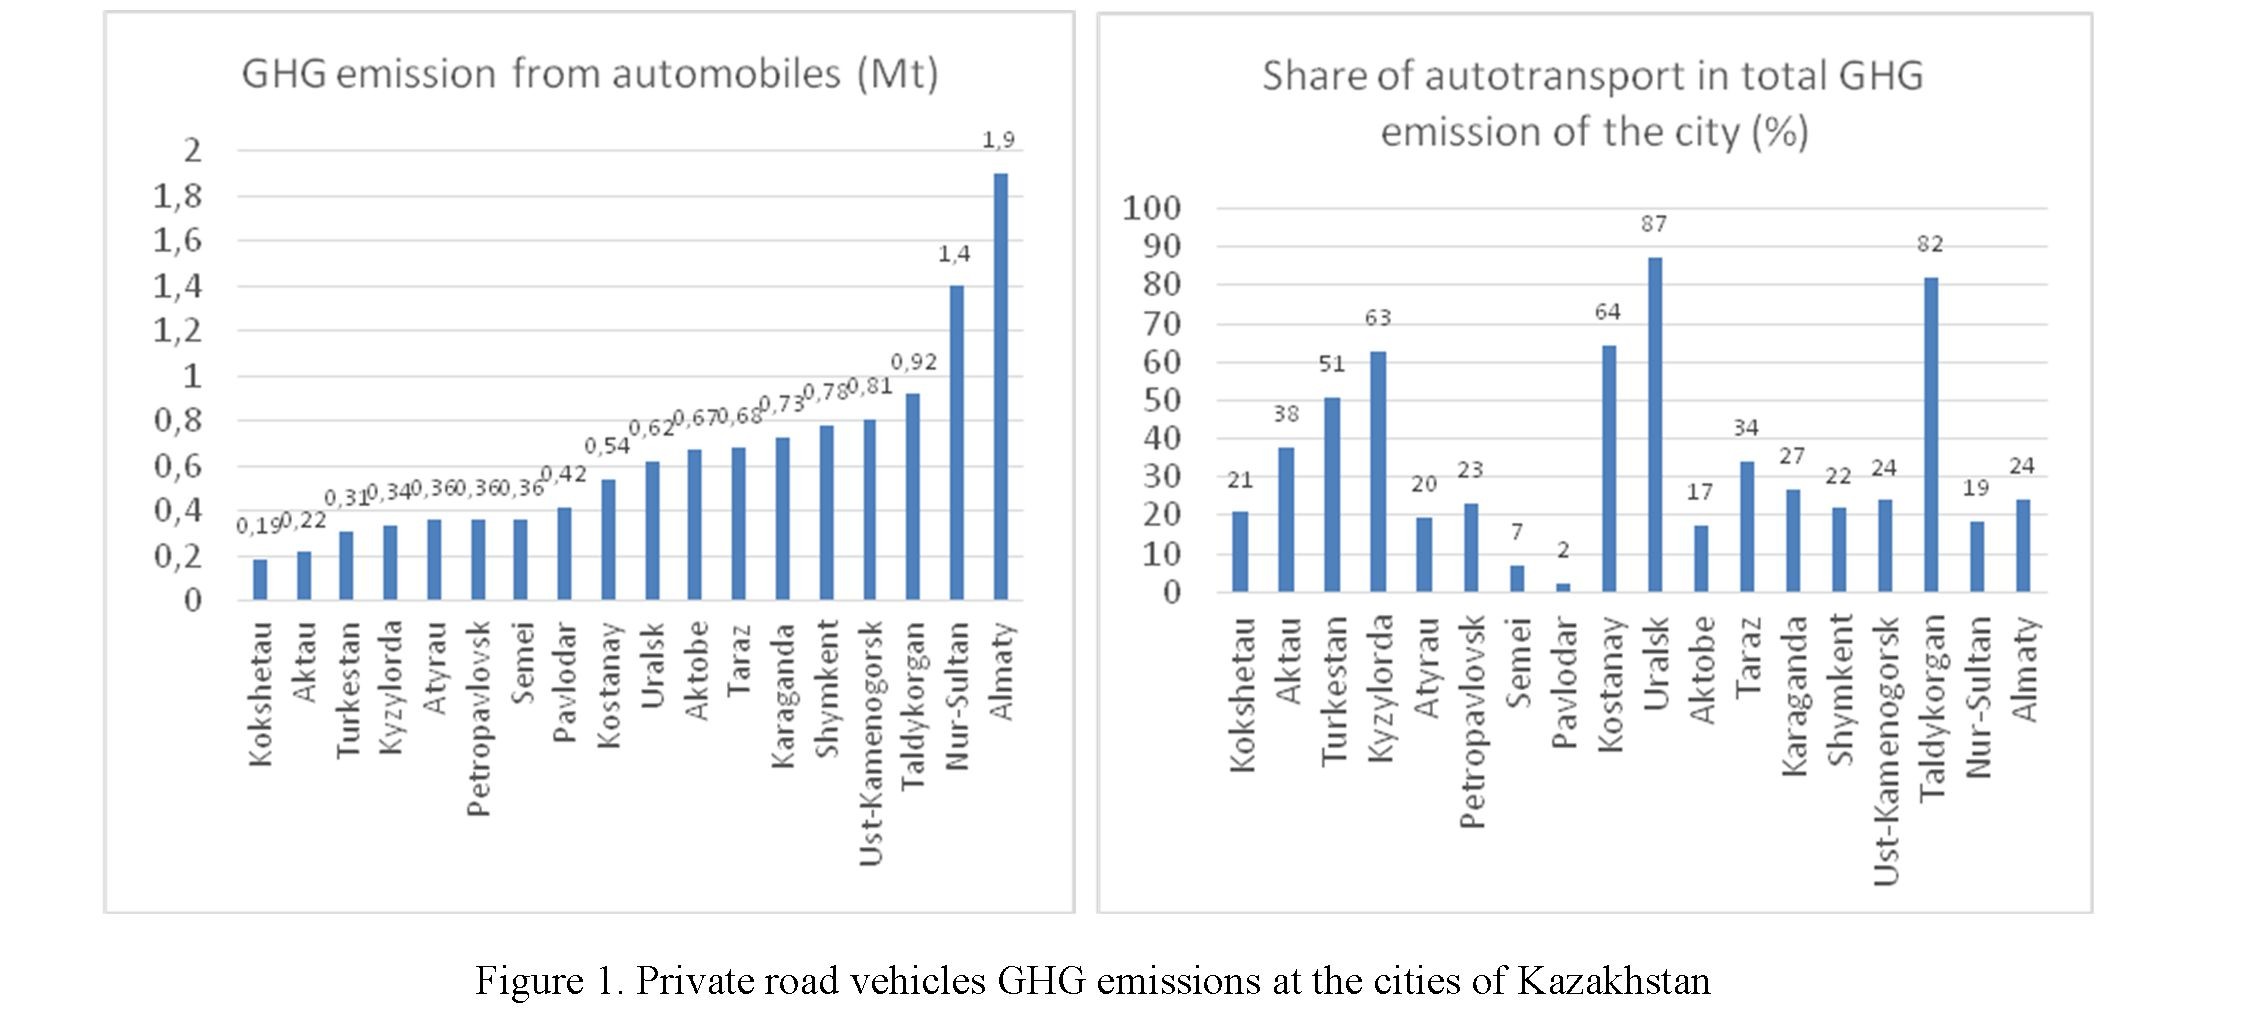
Figure 1 demonstrates the estimates of GHG emissions from large cities and regional centers. The maximum amount of emissions corresponds to the city of Almaty (1.9 million tons), where the maximum number of cars is registered.
The minimum volume of GHG emissions from vehicles is observed in Kokshetau (0.19 million tons). Low GHG emissions are typical for most cities in the South and South-West of Kazakhstan. Among the cities of the North of Kazakhstan, low emissions are typical for Petropavlovsk, and among the cities of the North-East of Kazakhstan — for Semei. Average emissions are typical for most cities in the Center, North and North-East of Kazakhstan. High emissions are observed in Karaganda, Shymkent, Taldykorgan, NurSultan. It should be noted that there is no unambiguous relationship between the number of cars and the volume of emissions. In different cities, the specific volume of emissions (tons per car per year) varies due to the influence of spatial and geographical factors, which will be described below.
Transport is the main source of GHG emissions in such cities as Turkestan, Kyzylorda, Kostanay, Uralsk, Taldykorgan. A common feature of these cities is the complete gasification of energy-producing installations, as well as a relatively small share of industrial emissions. In coal towns, the share of transport in total GHG emissions varies from 2 to 24 %. The minimum share of GHG emissions from motor transport is in Pavlodar, where significant industrial facilities, as well as facilities serving the public sector, use coal from the Ekibastuz basin as fuel, which is characterized by large specific emissions per kWh of generated energy.
In the course of the study, an assessment was made of the spatial differentiation of GHG emissions from vehicles for large cities and regional centers of the Republic of Kazakhstan. In this article, representative cities located in various regions of Kazakhstan are considered in detail.
As representative examples of the cities of Central, Northern and North-Eastern Kazakhstan, the cities of Nur-Sultan, Karaganda, and Ust-Kamenogorsk were selected; the city of Almaty was chosen as a representative example of cities in South-East Kazakhstan; among the cities of South Kazakhstan, a representative example of the city of Shymkent was considered. Representative Cities of South-Western and North-Western Kazakhstan were not considered, since their spatial and geographical features are in many respects close to the cities of South and North Kazakhstan, respectively.
In the analysis of the spatial distribution of greenhouse gas emissions from road transport, we used the indicator of specific emissions of tons/km of the road segment, since its use allows us to exclude false conclusions that are possible when analyzing the absolute values of emissions in cities where street segments differ significantly in length. The possibility of using a specific indicator for the length of the road, as well as emission density (for the area of the territory affected), was noted in [18, 19].
In Nur-Sultan (Fig. 2), which is compact, the structure of the road network is close to regular. In the city of Nur-Sultan, the maximum values of GHG emissions are typical for city streets, namely Nurgisa Tlendiev Avenue, turning into Bogenbai Avenue and Alash Highway (1653 kg/km); Korgalzhyn Highway (1588 kg/km); most streets of interdistrict significance, namely Republic Avenue (1740 kg / km), A. Imanov Street (2597 kg/km), Abay Avenue (1451 kg/km), S. Seifullin Street (2257 kg/km), Sh. Valikhanov (2226 kg/km) and some streets of the Yesil district, namely D. Kunaev streets (1887 kg/km) and Sarayshyk streets (1472 kg/km) and some other streets that fit the criteria described above. Average values of GHG emissions (700–
182
Вестник Карагандинского университета
1200 t/km) are typical for the majority of intra-district streets connecting opposite district boundaries. These streets are characterized by the presence of 2 to 6 traffic lanes and an average concentration. The minimum values of GHG emissions (less than 700 t/km) are typical for areas of private development and secondary streets of intra-district significance.
Despite the rather high connectivity of the road network within the administrative center of the right bank of the city, high specific values of GHG emissions are observed in this area. This indicates that the city center has exhausted the possibilities for upgrading the road network, and measures to reduce GHG emissions should be based on encouraging the use of alternatives to a private car.
In general, the crossing points across the Ishim (Yesil) River correspond to low and medium a GHG emission, which indicates the optimal location of bridges and interchanges at the approach to the river. The exception is bridges in the area of Sary-Arka and Turan streets, as well as Republic Avenue.
Almaty has a planning structure that combines elements of a regular and radial-circular type. At the same time, the density of streets in the central part of Almaty is much higher than in the central part of NurSultan. Almaty is characterized by the presence of a large number of residential areas on the periphery of the city. Thus, the density of streets in such areas is high.
The main contribution to greenhouse gas emissions from vehicles is made by the area bounded by Timiryazev, Nazarbayev, Raimybek, Rozybakiev streets. As in Nur-Sultan, the potential for increasing the connectivity of the road network in the central part of the city is largely exhausted, and measures to reduce GHG emissions in the area should focus on the development of alternative modes of transport to the private vehicle.
The planning structure of Shymkent is close to triangular, and on the periphery of the city, the density of streets and their connectivity drops significantly due to the presence of large industrial zones and the orientation of peripheral areas along the valleys of watercourses. In the central area with higher connectivity of the road network, specific emissions are relatively low for most streets, except for large streets that provide transit traffic through the city center to its peripheral areas. The greatest contribution to GHG emissions from motor transport is made by avenues of Republic, Qonaev, Baidibek Bi, Tamerlanovskoye Highway, Al- Farabi, Ryskulov, Zhibek Zholy streets.
The planning structure of Karaganda is close to free due to the historical features of the city development. The modern city of Karaganda was formed from several mining settlements located at a certain distance from each other. At the same time, the “Old Town” — the area of the original city center location ceased to exist because of the intensification of the subsidence formation in the area of coal mining. As a result, the city consists of isolated built-up areas with a large proportion of undeveloped areas in its geometric center. The new city center is located in the eastern part of the city, while housing construction is mainly taking place in the southeastern part. In addition, the connectivity of the street and road network of Karaganda city reduces the insufficient number of crossings through the railway separating the eastern and southeastern parts of the city.
Серия «Биология. Медицина. География». № 2(106)/2022
183
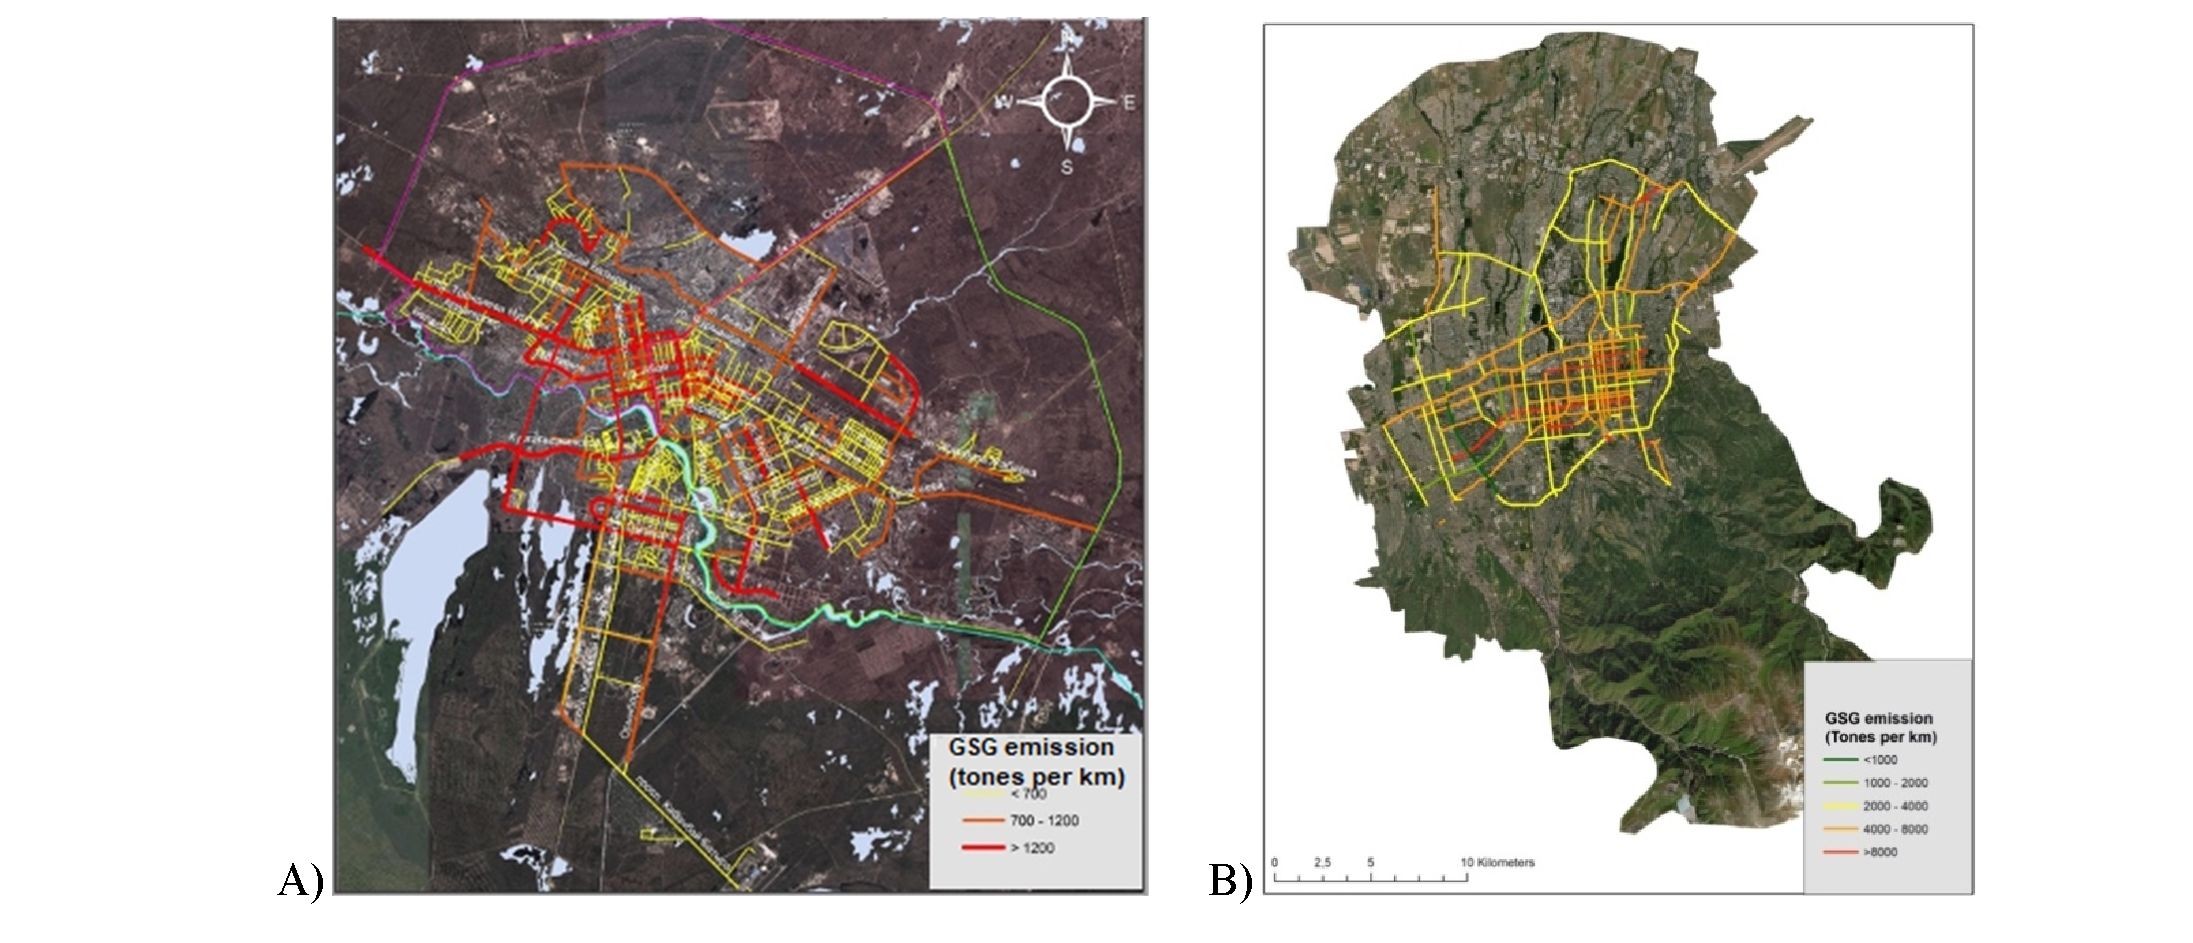
The maximum amount of GHG emissions is typical for Bukhar-Zhyrau Avenue and Gogol Street, which perform a transit function between the districts of the New City and the South-East. The specific amount of emissions for the streets connecting the New City with other districts of Karaganda is characterized by medium and low values. However, as the length of streets is long, their contribution to the total emissions is significant. It should be noted that there is a lack of crossings across the railway, which separates the areas of the New City and the South-East, in connection with which an increased density of emissions is recorded at existing crossings.
The street and road network of Ust-Kamenogorsk contains elements of a regular and radial scheme. The density of the road network on the periphery of the city is much lower than in its center. The presence of large industrial enterprises in the northern part of the city and has an insufficient number of crossings across the river. The Irtysh makes it difficult to travel by road. Increased specific emissions are typical for the area where Abay, Nazarbayev, and Ulba Bridge streets intersect. In this area, large streets are joined, providing transit between the city's districts, and therefore there is a bottleneck effect.
Significance of spatial and geographical factors of carbon intensity
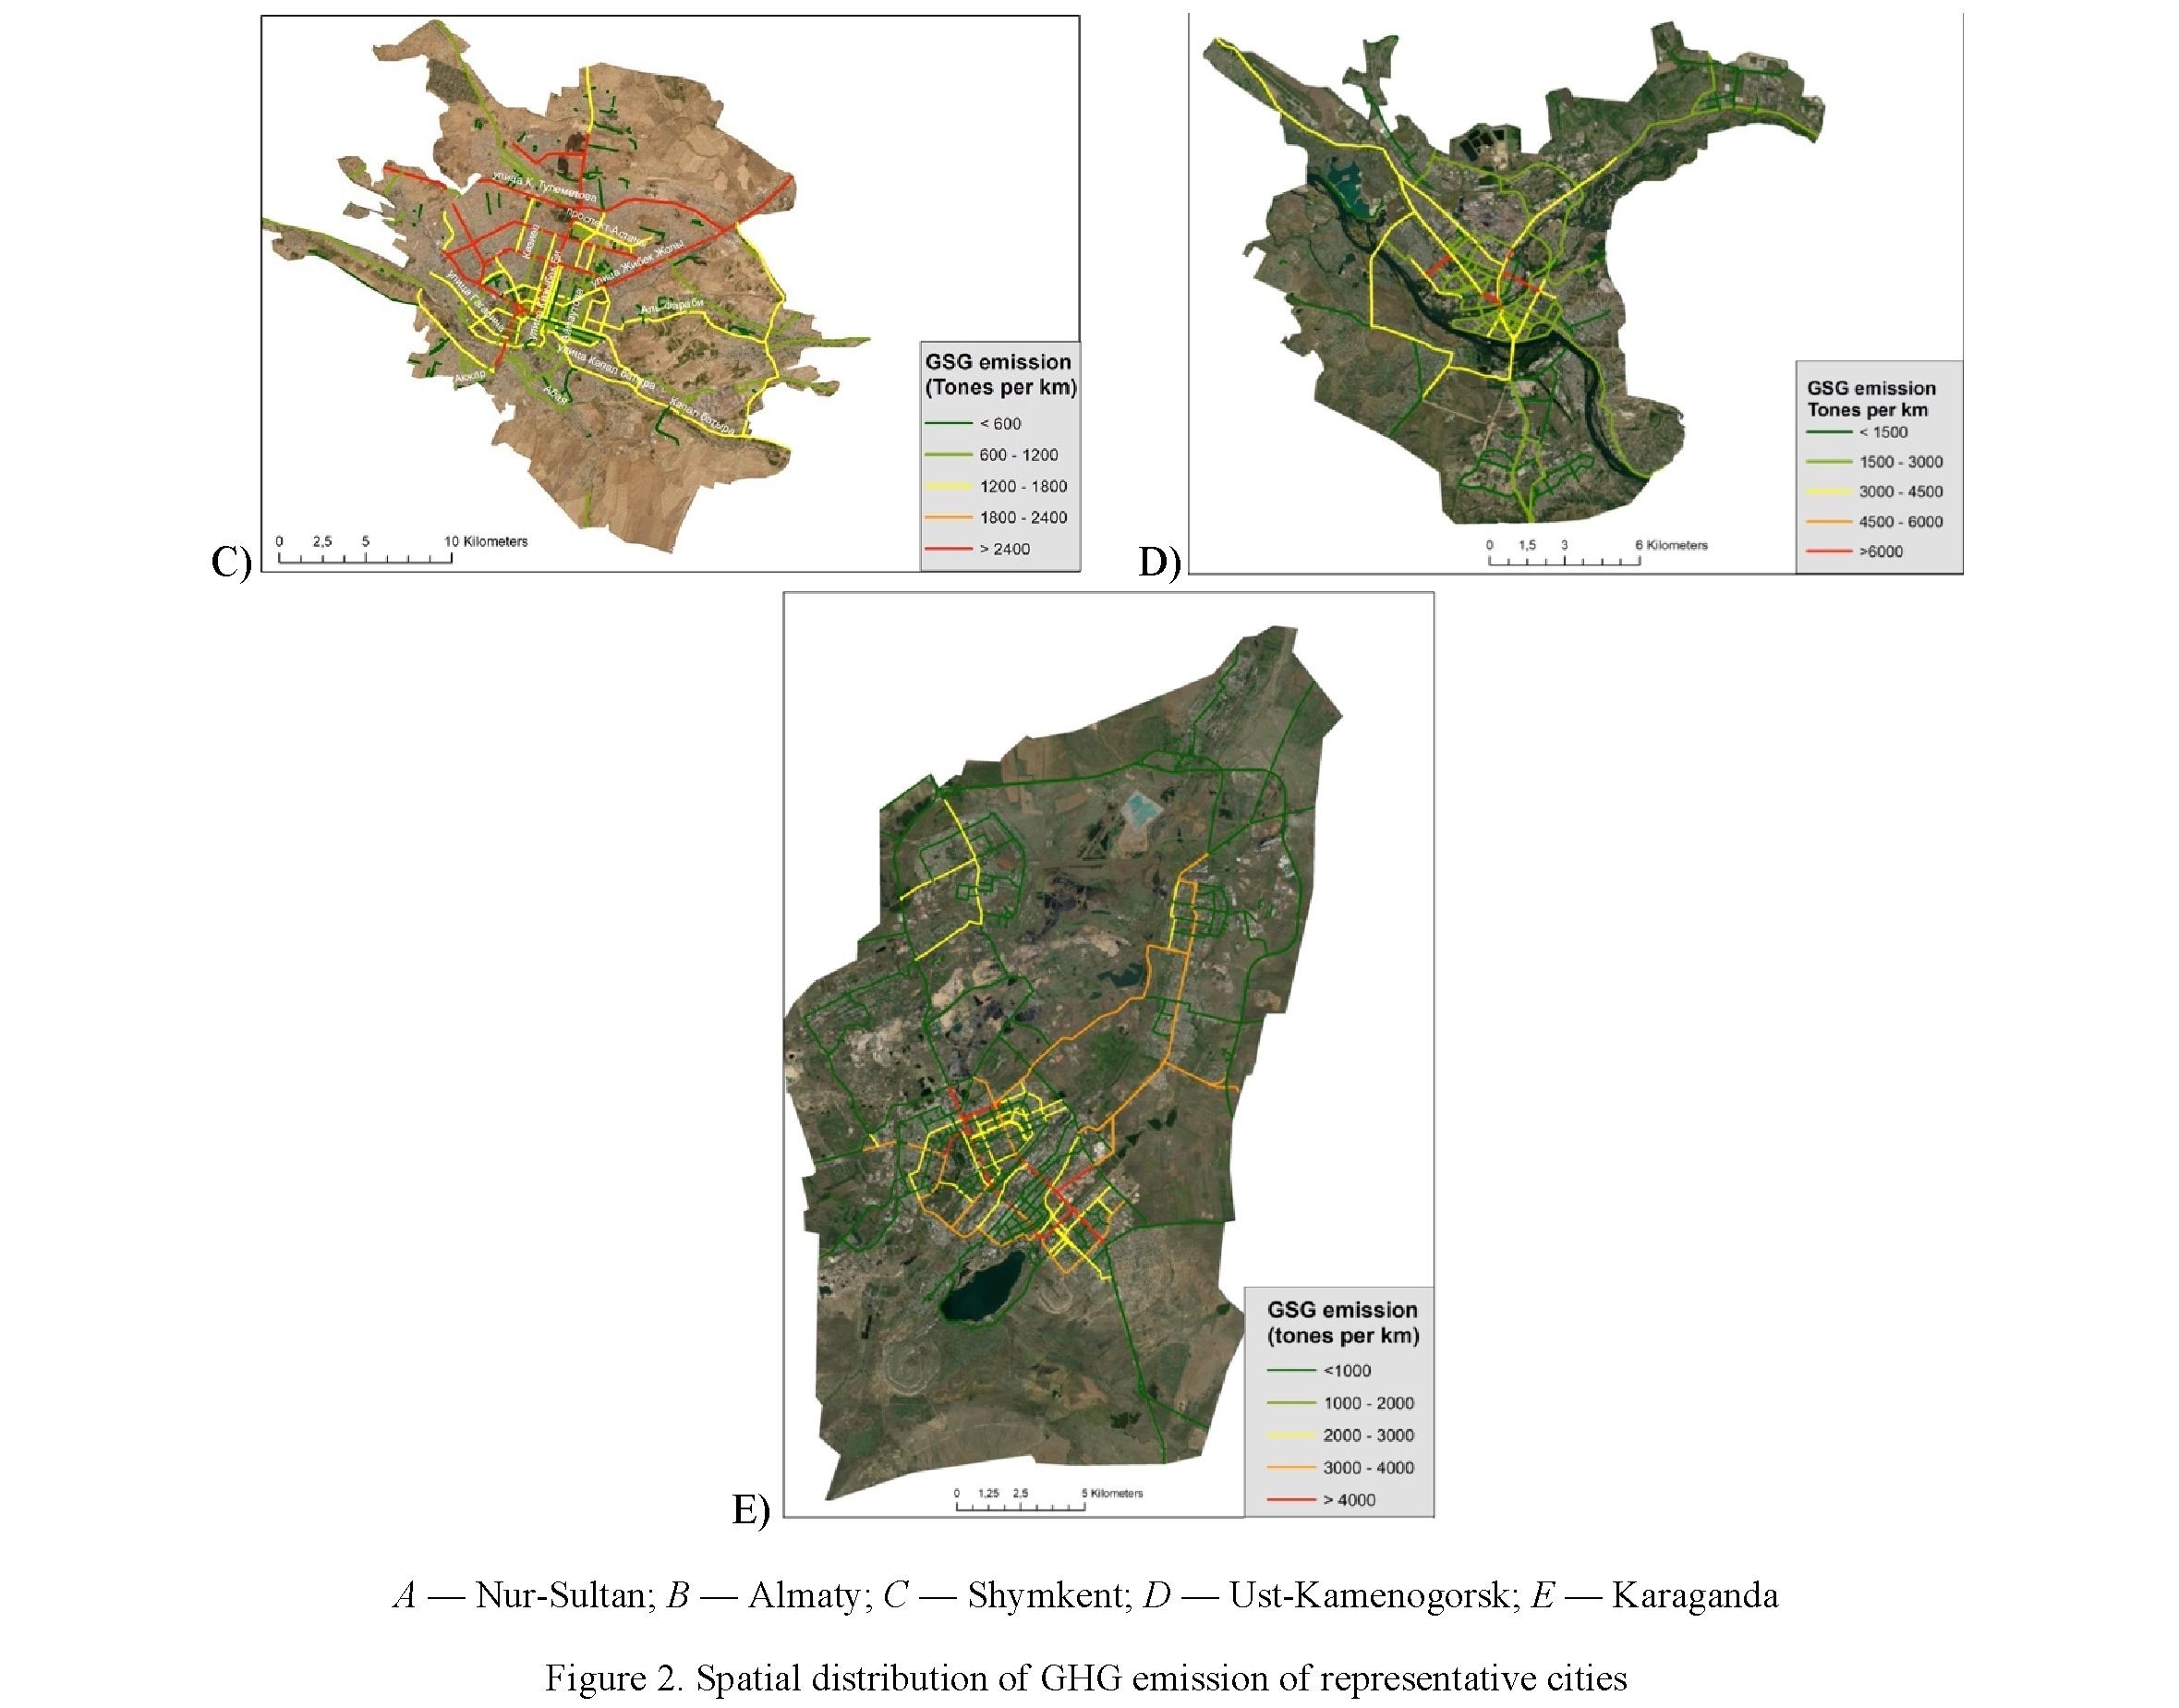
Vehicle fleet structure in terms of engine volume. The share of vehicles with high engine volume is one of the factors that increases the fuel consumption per vehicle, and hence the carbon intensity of vehicles. On average in Kazakhstan, the share of cars with an engine capacity of more than 3 liters is 17 %. The considered cities differ significantly in this indicator (Fig. 3). The maximum share of cars with an engine capacity of more than 3000 cm3 is observed in the cities of Aktau and Almaty (more than 23 %). The share of such
185
cars is minimal in Turkestan (less than 8 %). Above average, the share of cars with a high engine capacity is observed in the cities of Aktobe, Taraz, Atyrau, Kyzylorda, Petropavlovsk, Pavlodar, Ust-Kamenogorsk, Karaganda, Taldykorgan, Nur-Sultan.
According to [20], the difference between the average consumption of cars with engines larger than 3 liters and cars with the most popular engine size (1.6 liters) is about 42 %. As a consequence, when the structure of urban transport is reduced to the smallest share of cars with a large engine capacity among the considered ones, the total emissions of the considered cities are reduced by 0.36 million tons, or by 3.1 % of current emissions (Fig. 3).
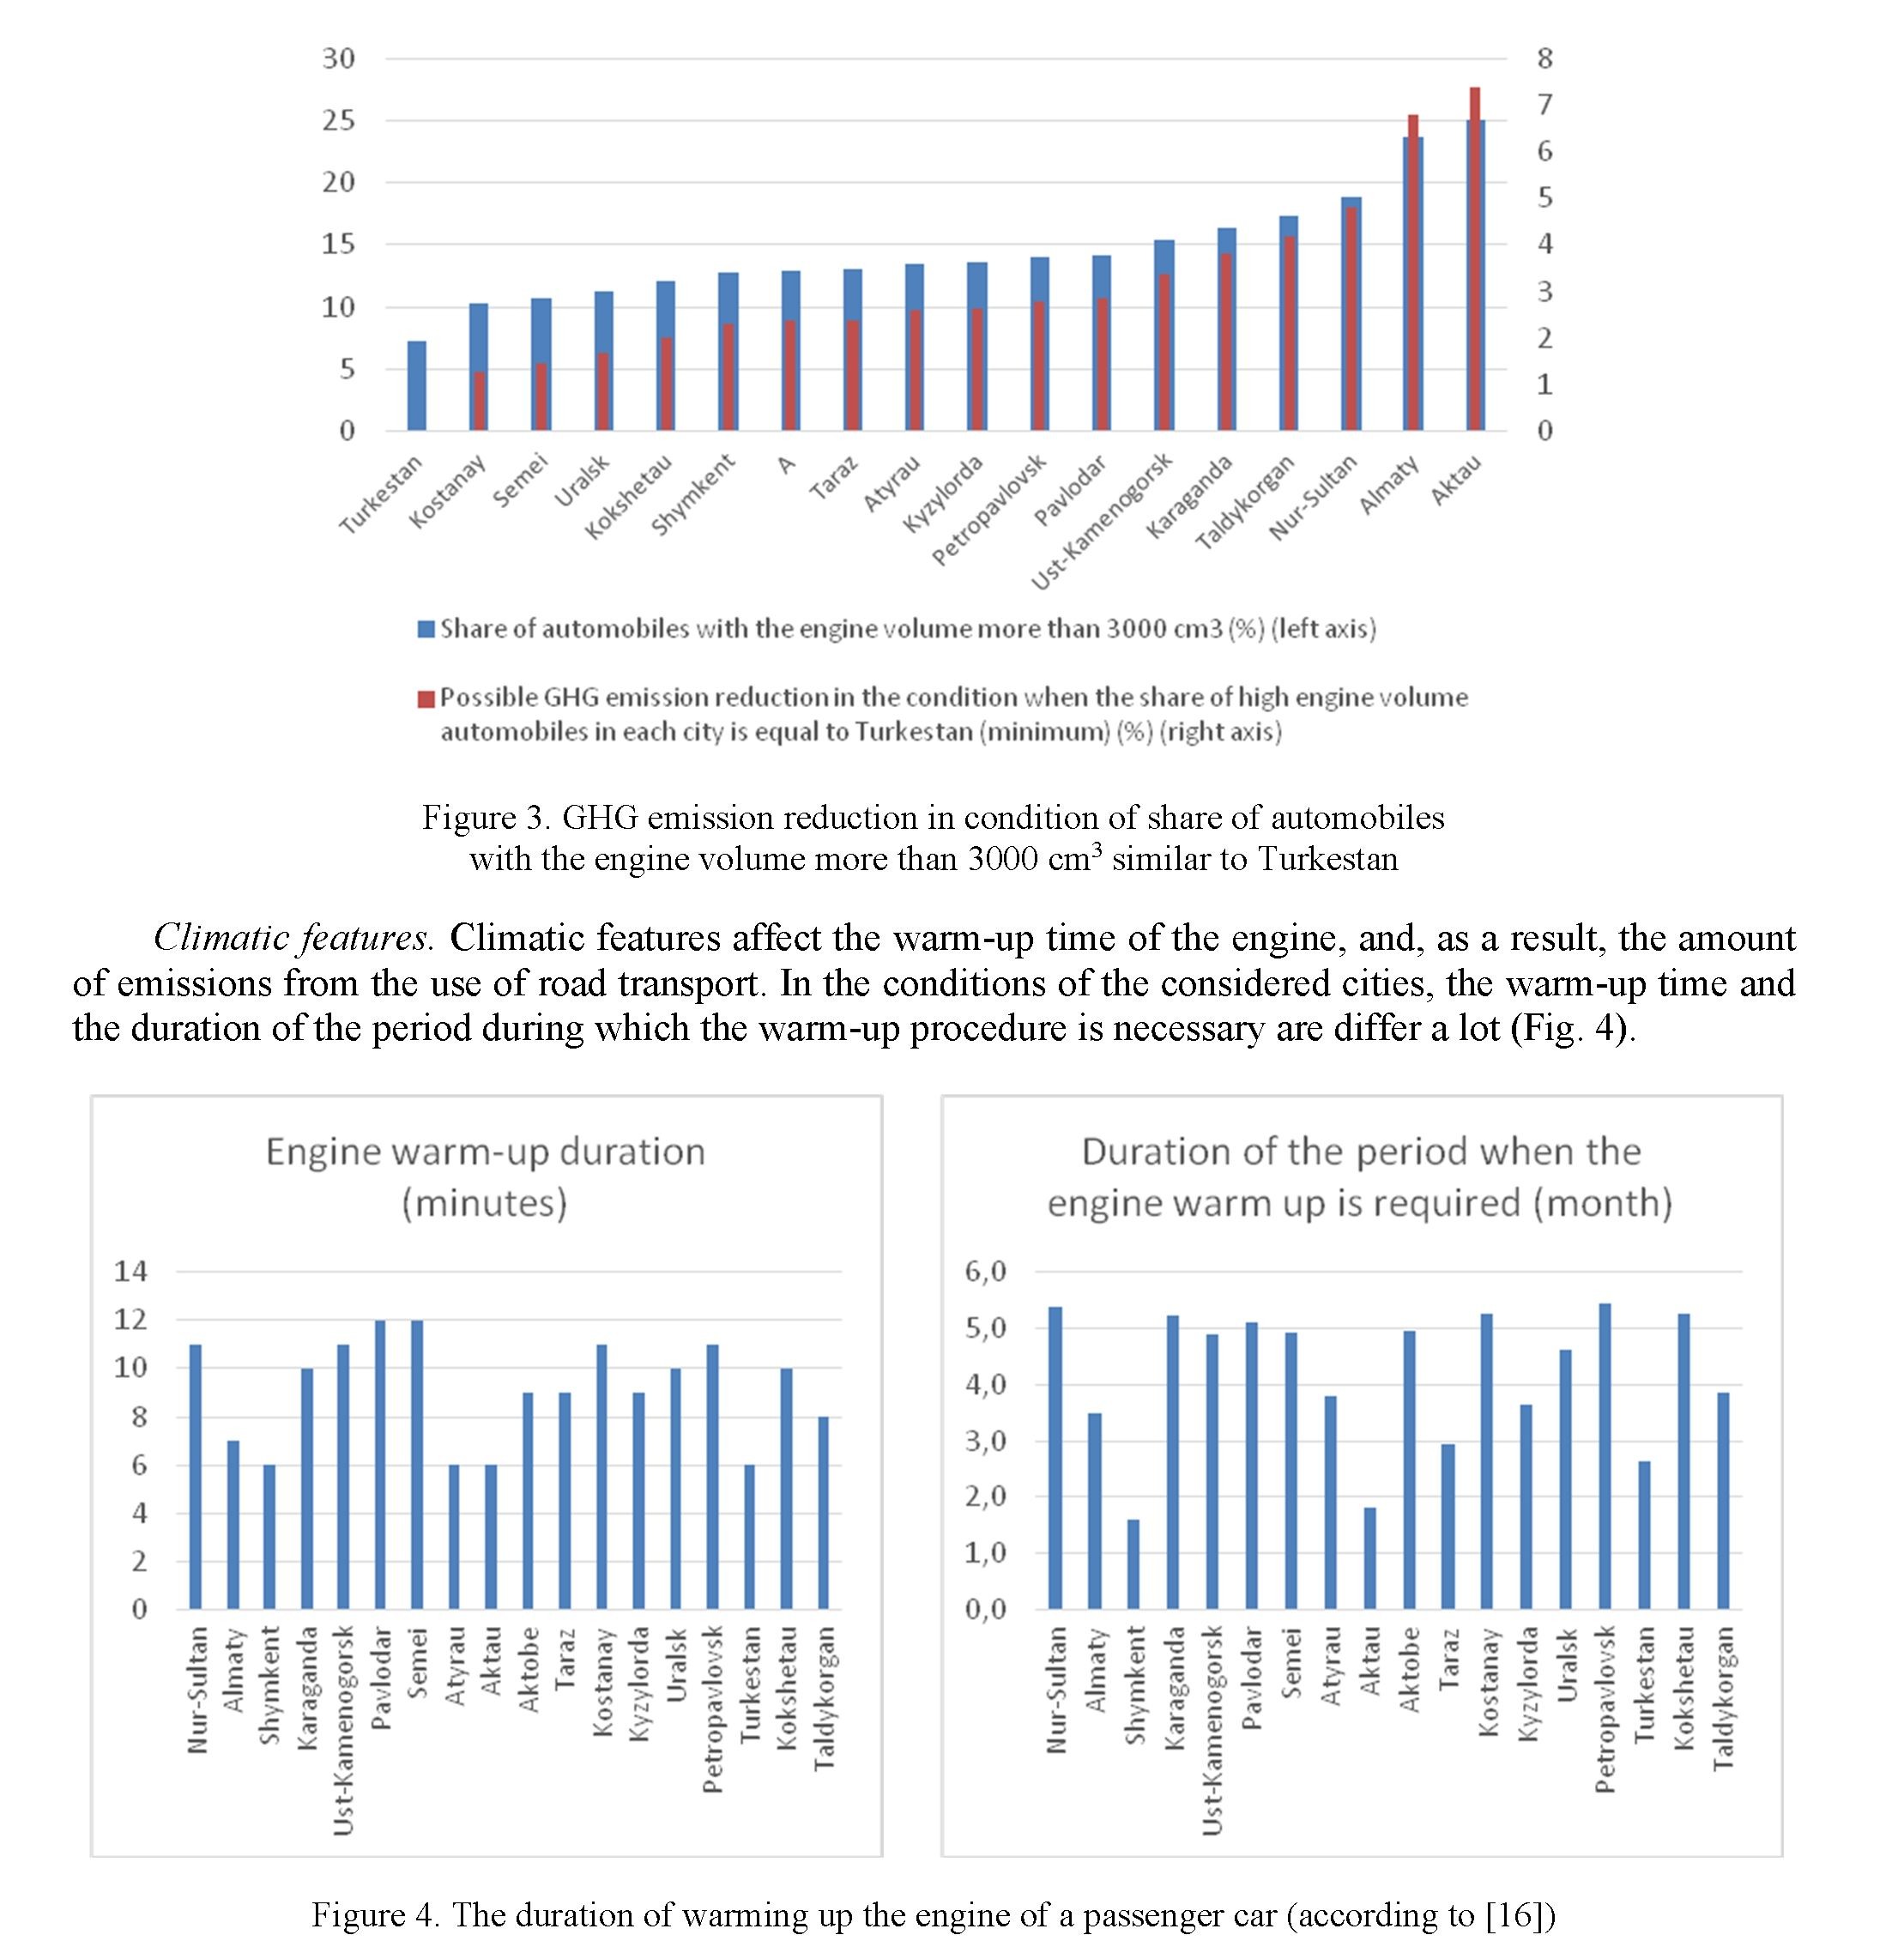
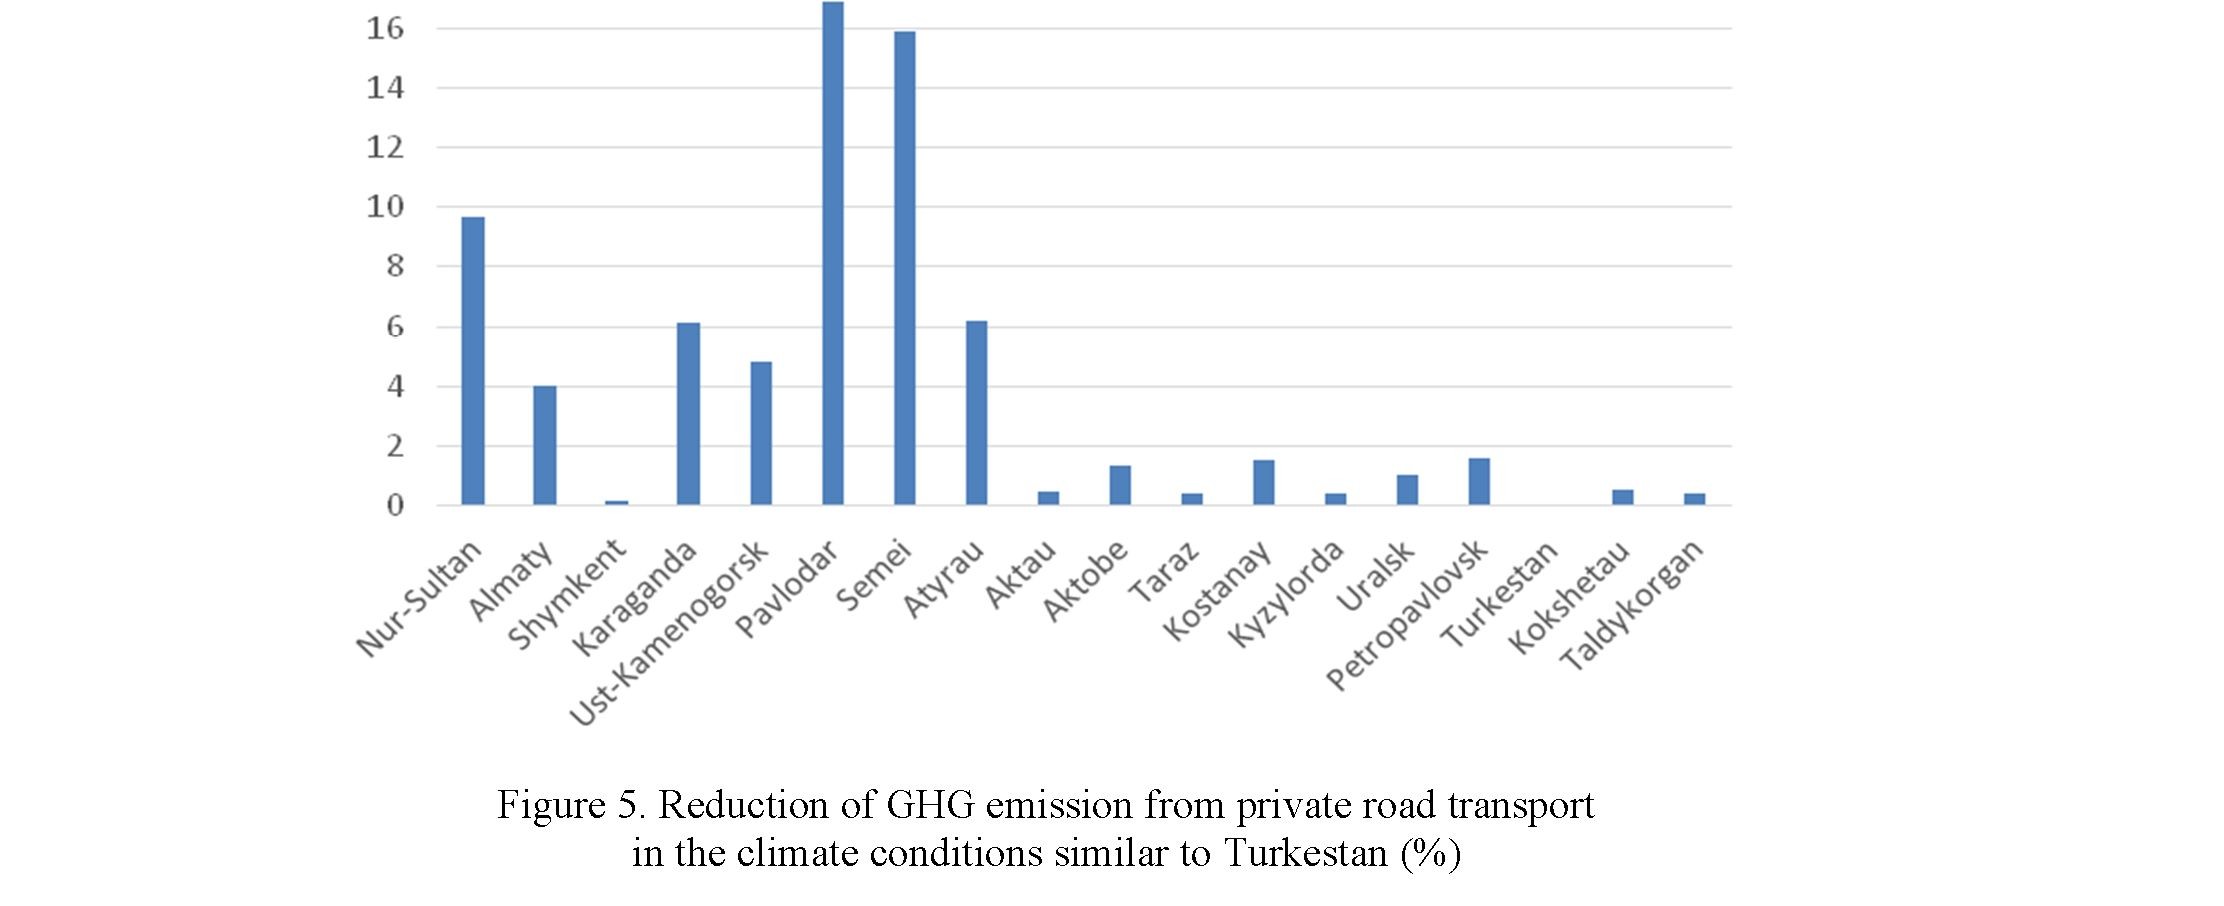
Climate features. According to our calculations (Fig. 5), considering that the fuel consumption during engine warm-up is from 0.8 to 1 liter per hour, depending on the type of car in terms of engine size, in the cities of Nur-Sultan, Pavlodar, Semei, the contribution of warming up to the total consumption of automotive
Серия «Биология. Медицина. География». № 2(106)/2022
fuel is more than 10 %. In the cities of Karaganda, Ust-Kamenogorsk, Atyrau, the contribution of engine warm-up to the total consumption of motor fuel exceeds the average value for the Republic. The lowest share of automotive fuel consumption associated with warming up the car engine corresponds to the city of Turkestan and is only 1.1 %. Under climatic conditions identical to the city of Turkestan, the reduction of GHG emissions from cities as a result of reduced engine warm-up time is 1.3 %. The most significant reduction occurs in the cities of Atyrau, Pavlodar, Nur-Sultan, Karaganda, Semei.
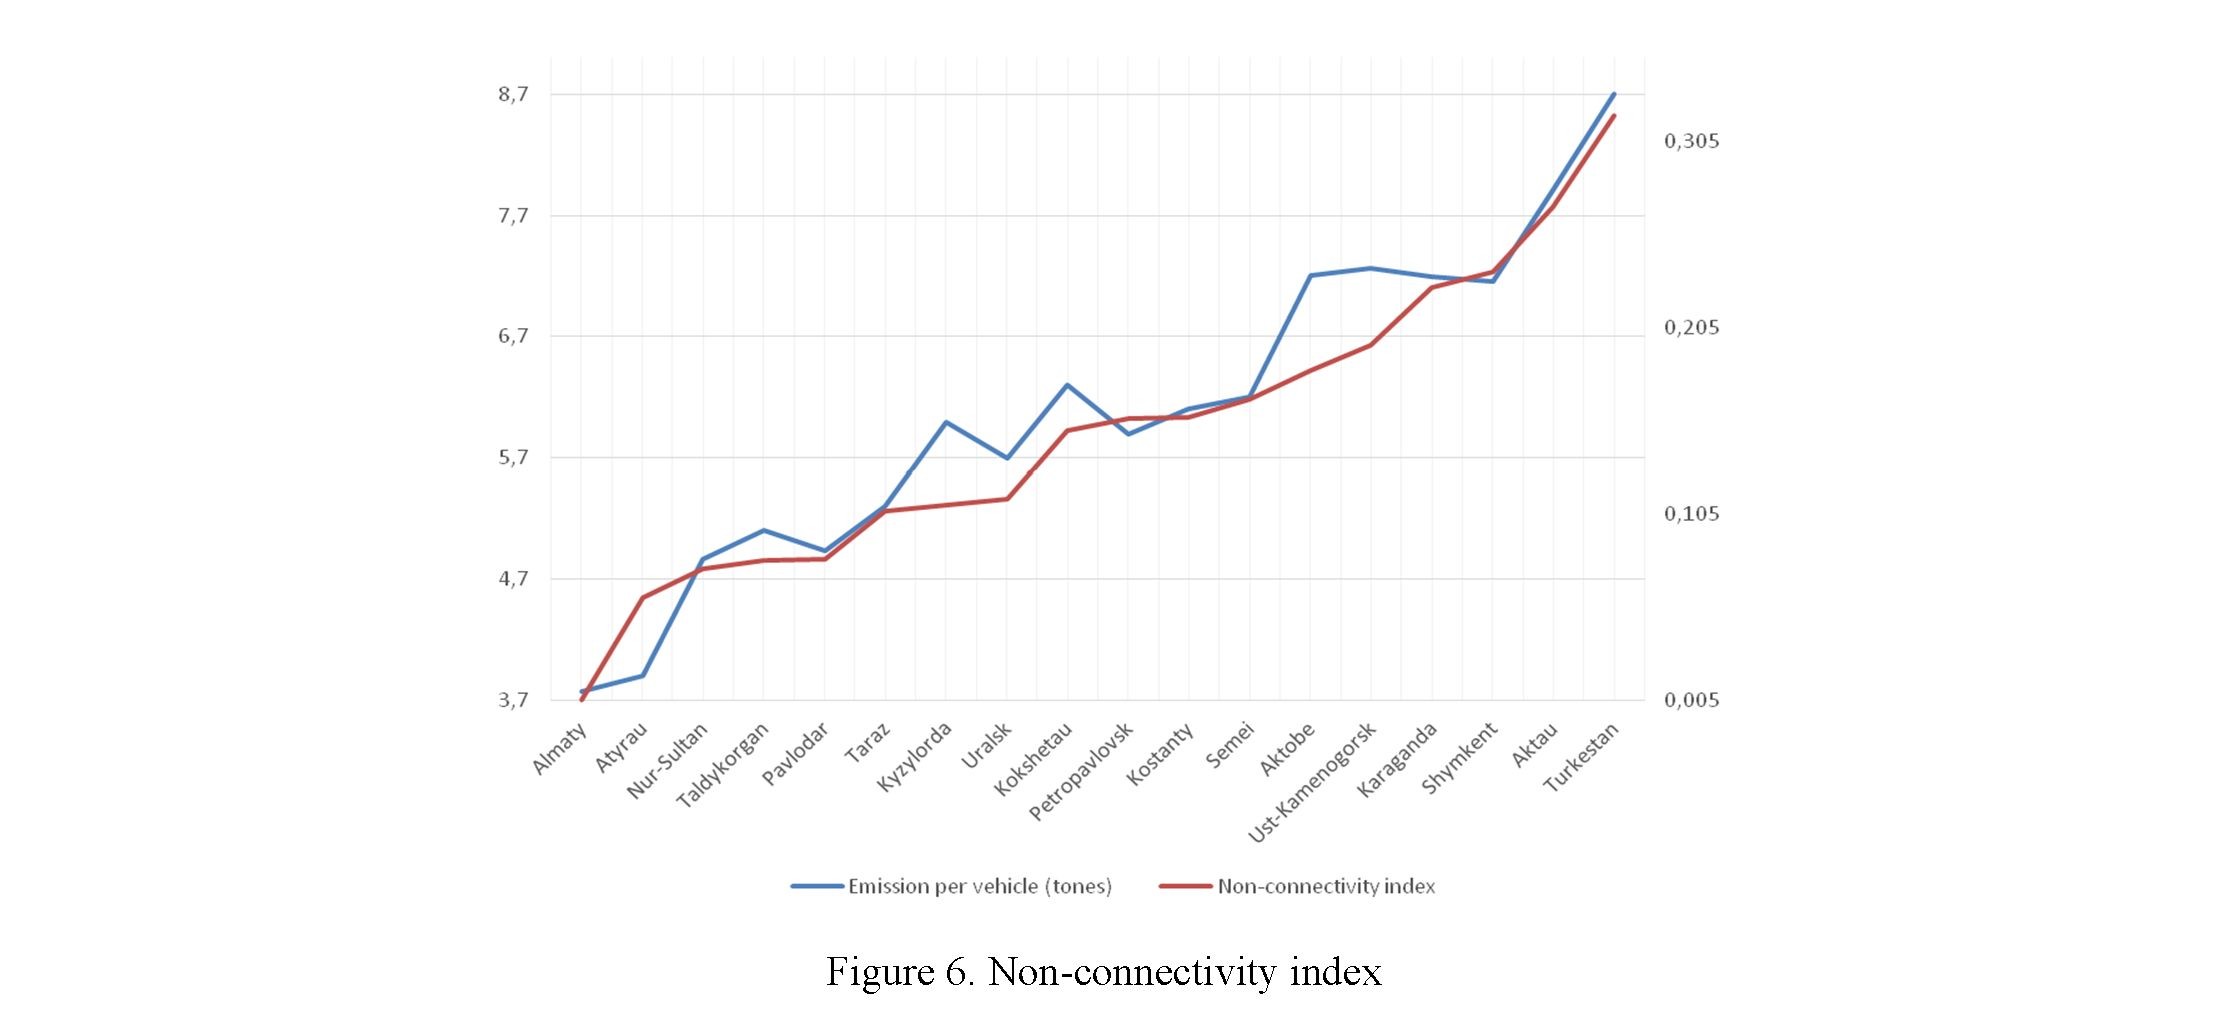
Connectivity of the road network. Among the considered cities, the non-connectivity index of road network (Fig. 6) varies from 0.005 in Almaty to 0.31 in Turkestan. A high non-connectivity index is typical for the cities of Shymkent, Aktau, Karaganda, and Ust-Kamenogorsk. In these cities, connectivity is reduced either by man-made or natural barriers that prevent the construction of a regular road network. A low nonconnectivity index is typical for Nur-Sultan, Pavlodar, Taldykorgan, Kyzylorda. These cities are located in a relatively flat terrain, and their residential areas are located compactly. As a result, the street-road network of the described cities is close to regular.
There is a high (more than 0.7) Pearson correlation coefficient between the disconnection index and GHG emissions per vehicle. The connectivity of the road network should be considered the main factor determining the amount of GHG emissions from private vehicles.
187
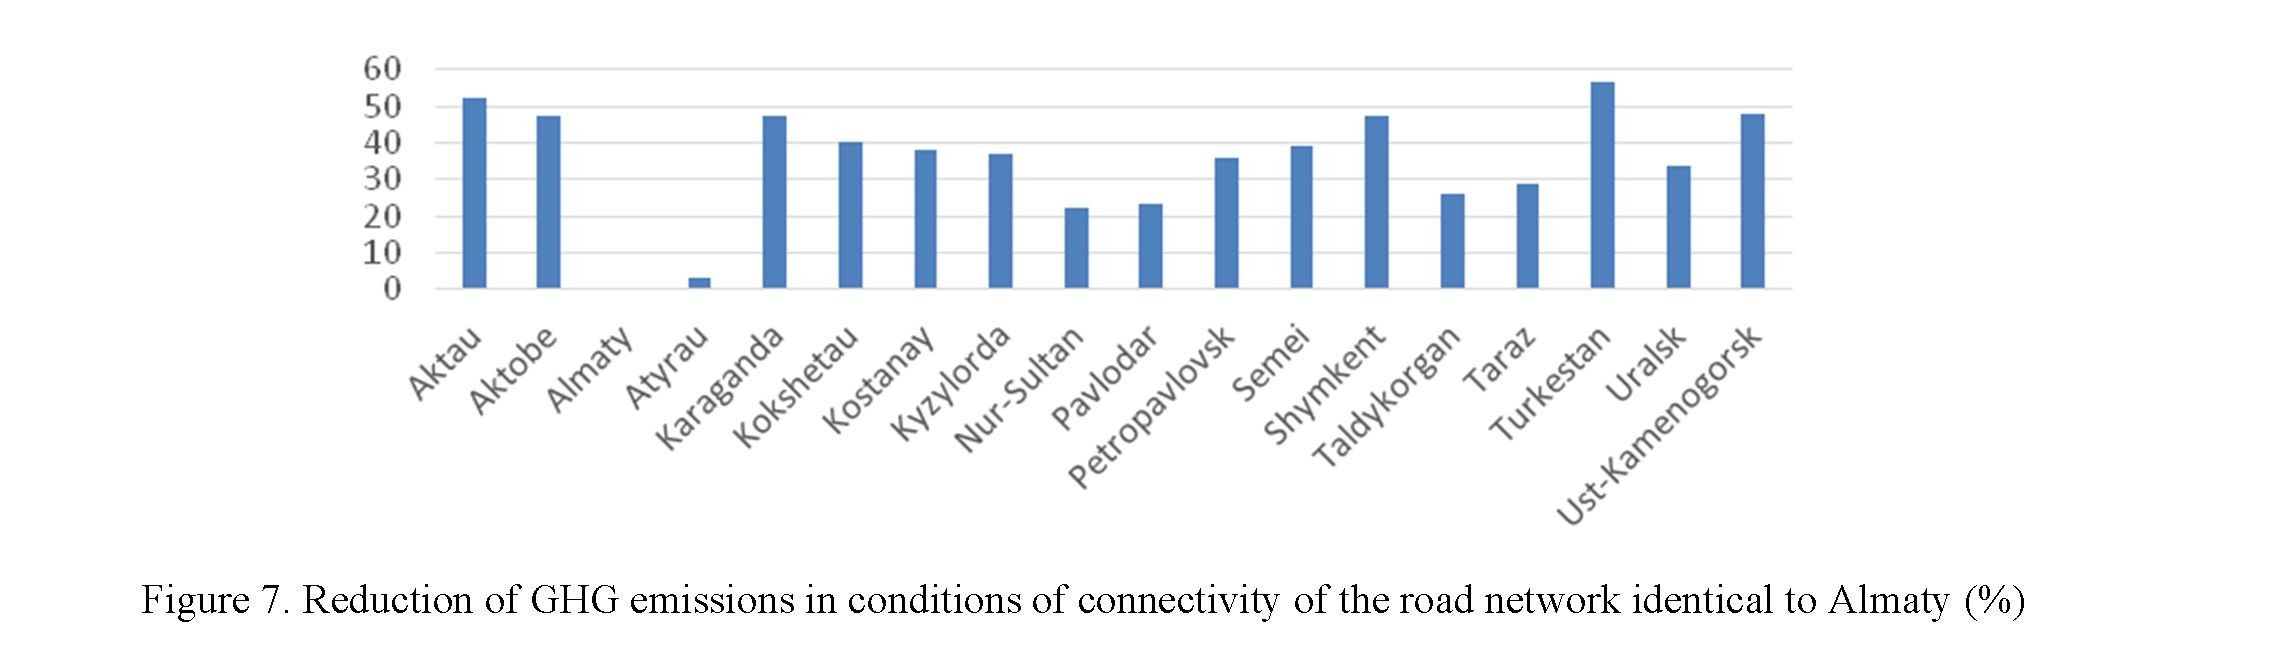
Under the best conditions of connectivity of the road network (identical to Almaty), the total GHG emissions in the considered cities are reduced by 30 % (Fig. 7).
Conclusions
Private road transport is a significant source of urban greenhouse gas emissions. City private transportation accounts 18 % of Kazakhstan emissions.
In cities characterized by the predominance of gas in the fuel and energy balance, private vehicles are the dominant source of greenhouse gas emissions. Thus, in Turkestan, Kyzylorda, and Uralsk, the share of GHG emissions from vehicles ranges from 51 to 64 %.
The largest volume of GHG emissions from private road vehicles is typical for Almaty and Nur-Sultan. In general, these cities provide about 30 % of all transport emissions in Kazakhstan. These cities have the maximum number of registered cars in Kazakhstan.
However, there is no direct relationship between the number of cars and GHG emissions. Specific emissions per car vary a lot: from 3.8 tons per car per year in Almaty to 8.7 tons per car per year in Turkestan. Such differences are due to the structure of the vehicle fleet in terms of engine size, the connectivity of the road network and climatic features.
Stimulating the use compact (low volume engine) cars in the Republic of Kazakhstan as a whole can lead to a reduction in GHG emissions from transport by 1.3 %. Increasing the connectivity of the road network can lead to a 30 % reduction in GHG emissions from motor vehicles.
Differences in the carbon intensity of urban transport associated with climatic features exceed 5 %.
Measures to reduce GHG emissions from vehicles are hampered by the lack of reliable estimates of the spatial distribution of GHG emissions in certain areas of the city. The conducted studies showed that in the cities of Nur-Sultan and Almaty, the potential for reducing emissions through the modernization of the road network has been largely exhausted. In the cities of Karaganda, Shymkent, Ust-Kamenogorsk, production sites of enterprises, technogenically transformed territories and natural objects fragment the road network, reducing the connectivity factor.
Thus, the implementation of measures to decarbonize the transport sector allows the cities of Kazakhstan to make a significant contribution to the implementation of national goals adopted under the Paris Agreement. The implementation of measures in the transport sector is of particular importance in the cities of the West, South-West and South of Kazakhstan.
References
- Cities and climate change: Strategy directions. Global report on human settlements. London; Washington, DC –– 2011.
- Intended Nationally Determined Contribution — Submission of the Republic of Kazakhstan. Retrieved from https://www4.unfccc.int/sites/ndcstaging/PublishedDocuments/Kazakhstan%20First/INDC%20Kz_eng.pdf
- Доктрина (Стратегия) достижения углеродной нейтральности Республики Казахстан до 2060 года (Проект). Электронный ресурс. Режим доступа: https://legalacts.egov.kz/npa/view? id=11488215
- Указ Президента Республики Казахстан от 30 мая 2013 года № 577. О концепции перехода Республики Казахстан к «зеленой» экономике [Электронный ресурс]. Режим доступа: https://adilet.zan.kz/rus/docs/U1300000577
- The London Plan. The spatial development of London consolidated with alterations since 2011. — London: Greater London Authority, 2015. — 408 р.
- Chicago Climate action plan. Chicago: Chicago Authority, 2010. — 60 р.
- Методические указания по расчету эмиссии «зеленых» газов от предприятий мототранспорта. RND. — Астана, 2010. — 22 с.
- Руководящие принципы оценки выбросов из неточечных источников. — Женева: UNITAR RWP Technical Support, серия 3. — 1998. — № 3. — 71 с.
- Choi J. Forecast of CO2 Emissions From the U.S. Transportation Sector: Estimation From a Double Exponential Smoothing Model / J. Choi, B.C. Roberts, E. Lee // Journal of the Transportation Research Forum. — 2014. — Vol. 53 (3). — P. 63–81.
- Giri S. Building a Carbon Dioxide Emissions Model for the City of Redlands S. Giri. — MS GIS Program Major Individual Projects. — 2010. — Vol. 8. — P. 88.
- Kerimray A. Analysis of the energy intensity of Kazakhstan: from data compilation to decomposition analysis / A. Kerimray, I. Kolyagin, I.B. Suleimenov // Energy Efficiency. — 2018. — Vol. 11. — P. 315–335.
- Shipper L. Transport and Carbon Dioxide Emissions: Forecasts, Options Analysis, and Evaluation. Transport and Carbon Dioxide / L. Shipper, H. Fabian, J. Leather. — Asian Development Bank, 2009.
- Абдельдинова Д.Ж. Опыт использования концепции и морфотипа застройки для геоэкологических исследований городов (на примере Астаны) / Д.Ж. Абдельдинова, О.А. Климанова, Е.Ю. Колбовский // Мир геоэкологии. Геоэкологические проблемы и пути их решения. — М.: МГУ, 2017. — С. 298–308.
- Кочуров В.И. Эколого-градостроительный баланс и перспективы развития мегаполиса Москвы как центра конвергенции / В.И. Кочуров, И.В. Ивашкина, Ю.И. Ермакова // Экология урбанизированных территорий. — 2019. — № 3. — С. 65–73.
- Дехнич В.С. Моделирование объемов выброса парниковых газов в городах с использованием данных различной детальности / В.С. Дехнич // Inter Karto. Inter GIS. — 2020. — Т. 26. — С. 257–270.
- Кулашов А.С. Условия и факторы атмосферного загрязнения автотранспортом на примере городов-миллионников России и Казахстана / А.С. Кулашов // Ломоносов — 2019: XVI Междунар. науч. конф. студ., магистр. и молод. ученых. — Нур-Султан: Казахстанский филиал МГУ им. М.В. Ломоносова, 2019. — С. 227–230.
- Дехнич В.С. Расчеты выброса парниковых газов при использовании дородного транспорта города Астаны / В.С. Дехнич // Aspirant. — 2015. — № 10. — С. 68–74.
- Битюкова В.Р. Экологический портрет российских городов [Ecological portrait of Russian cities] / В.Р. Битюкова, Н.С. Касымов, Д.В. Власов // Экология и промышленность России. — 2011. — № 4. — С. 6–18.
- Касымов Н.С. Проблемы экогеохимии крупных городов / Н.С. Касымов, В.Р. Битюкова, А.В, Кислов // Разведка и охрана недр. — 2012. — № 7. — С. 8–13.
- Постановление Правительства Республики Казахстан от 11 августа 2009 г. № 1210. Об утверждении норм расходов горюче-смазочных материалов для государственных органов Республики Казахстан и расходов на содержание автотранспорта [Электронный ресурс]. Режим доступа: https://adilet.zan.kz/rus/docs/P090001210_