Ground monitoring of soil massifs takes a lot of time, labor force and material resources, yet is the most accurate and detailed method. When implementing complex methods for monitoring the soil cover, inclusion of space technologies is necessary. Remote sensing data carry objective information over the large areas. The article discusses the possibility of using remote sensing data for mapping and monitoring changes in the soil cover of Northern Kazakhstan. Based on thematic processing of remote sensing data of domestic satellites, spatial analysis of the content of main nutrients was executed in the sowing layer of soils, the relationship was revealed between fertility indicators and the value of vegetation indices for testing ground on the territory of Northern Kazakhstan. Remote sensing methods which are gaining more practical application in determination of qualitative changes in the state of the Earth's surface are considered in this article. The use of remote sensing data enables developing automatic soil recognition and analysis systems for the quantitative assessment of soil variability. The use of remote sensing data of high and medium resolution, along with geoinformation technologies reveals great potential in assessing soil fertility, which contributes to the effective management of land resources, the preservation and maintenance of soil fertility.
Introduction
Rational use of land resources is a priority area of country's land policy. The most important characteristic of agricultural lands is fertility, which accumulates the soil quality; accordingly, there are requirements for the monitoring of land use and fertility conservation.
The soil map is the main document which enables a qualified assessment of land cover, as well as the development of a system of practical measures aimed at improving soil fertility. Using digital mapping methods based on remote sensing data can be a solution of the objectives on updating information on the condition and properties of soil cover at high costs for field mapping and a limited number of specialists.
The application of new methods for describing the spatial laws of soil properties is relevant, including aerospace methods for determining the characteristic scales of spatial variation of the soil cover and revealing the average size of the soil individual, geostatic methods for quantifying soil variability, creating regional and global soil databases and others.
Reliable and relevant data on the state of soil fertility will optimize decisions on the management, conservation and maintenance of soil fertility. The research results will become the basis for taking operational measures to eliminate the objective and subjective reasons of reducing the quality of agricultural land, along with improvement of the environmental safety of agricultural production. The latest technologies for monitoring soil fertility will become the basis for making forecasts of changes in land conditions and will serve as the main source for creating soil-agroecological maps, cartograms of fertility, etc.
There is a shortage of relevant soil data of the agrochemical state of arable land of the country. Therefore, the agrochemical service of Kazakhstan can annually monitor 1.8 million hectares of arable soils, and considering the country's area of 2.7 million square km, the frequency of agrochemical surveys does not ensure monitoring and management of land resources with updated data every five years.
Soil maps of 150.2 million hectares of the country's territory were compiled before 1990 and require reexamination. Only remote sensing data can provide a unique opportunity to implement comprehensive and effective monitoring over large areas, saving material resources, labor force and time. Currently, the research topic is highly relevant and significant.
The current state of remote monitoring technologies of soil cover is characterized by the development of digital analysis tools, integration with GIS technologies and creation of an information field for open data sources. This allows the integration of information with the development of new criteria and features which characterizes the state of the soil cover [1].
As a result of the analysis of multi- temporal space-based information over the study area, several signs of changes have been revealed in the level of fertility, reflecting the following processes that adversely affect productivity of arable soils: flat flushing, linear erosion, flooding, etc.
Remote sensing data allow obtaining comprehensive and comparable information simultaneously for large, distant and inaccessible territories that in this regard surpassing any ground-based surveys. The use of remote sensing data enables developing systems for automatic soil recognition and soil analysis. Based on the visible satellite imagery from the «WorldView-1» spacecraft with a resolution of 50 m, the state of soils in the Noginsky district is estimated and polluted areas are eliminated [2].
Multispectral remote information reflects the functional features of ecosystem. The reflection values are in different spectral bands and their ratios contain information on biological productivity, chemical composition of plants, moisture content in vegetation and soil. As a result, it can be assumed that multispectral measurements reflect the texture, chemical composition of the soil-forming rock and the stage of endogenous soil development. The high sensitivity of multispectral information to changes in the biophysical and biochemical properties of ecosystem components has been shown in numerous studies [3–5]. Consequently, a basis is formed not only for the correction of the soil map that was compiled using traditional methods, but also for the analysis of the factor basis for the formation of soil covers [6].
A nonlinear relationship was established between the brightness of the red band in remote sensing of the Earth and the humus content in the arable horizon of gray forest soil. The coefficient of determination for the equation turned out to be very high (R2 = 0.965). Calculations of the humus content using it practically coincided with the average values obtained by independent determination of the humus content in mixed samples [7]. A number of issues of the methodological nature of soil monitoring require scientific study, primarily at the regional level in relation to specific soil and climatic conditions. Scientific approaches to the timing and technique of selecting soil samples, rational levels of indicators of the properties of various types and varieties of soils require changes. Comprehensive monitoring of soil fertility should also include remote sensing methods for a continuous survey of soil fertility and coverage of the regions that account for the bulk of agricultural production, for developing regional optimal values and the range of their possible fluctuations and enterprises for effective operational decisions on production management [8].
Materials and methods of research
The need for soil mapping using the analysis of the Earth remote sensing data from space station, first of all, is due to the inadequacy of large-scale soil maps owing to the use of the old materials of the soil survey, boundary adjustment of the soil map arises from the need for reflection of the actual structure of the soil cover owing to the changing modern environmental, economic and technological conditions of agricultural production, etc.
When studying remote sensing materials along with an image of the area of interest and when comparing it with a soil map, objective perception on the patterns of soil distribution in relation to the terrain is created, interpretation of features of different soils are established, inaccuracies in the selection of soil contours, also missing contours and other shortcomings are revealed in the map that is being corrected.
Probable causes of deficiencies are being figured out, availability of soil contours along with incisions are being analyzed and selectively getting acquainted with their description. To this end, the journals with field descriptions of the incisions along with the field soil map are used, where the points of incisions are mapped.
The territories where changes in the soil cover are possible due to human activities (such as improvement or deterioration of soils) are obtained by analyzing the satellite image. Bigness of the fields, the tone of images, absence or presence of spotting on its surface, depiction of «effusions» of salts, erosion gaps are reference features for determination of the state of the soil cover.
Primary cause of change in soil fertility is the use of soils as the main means of production. It is the agronomic grouping of lands and the efficient use of land resources that affect the qualitative composition of soils, and the change in the generic and species characteristics of soils. Analysis and presentation of the agronomic interpretation of soils based on remote sensing data should become the basis for developing recommendations for the grouping of soil objects depending on the level of potential fertility and the agricultural production structure of the region.
The solution to this problem lies in an integrated approach to the assessment of agricultural land — the use of adaptive-landscape farming system approaches and in the conduct of agroecological monitoring of land use.
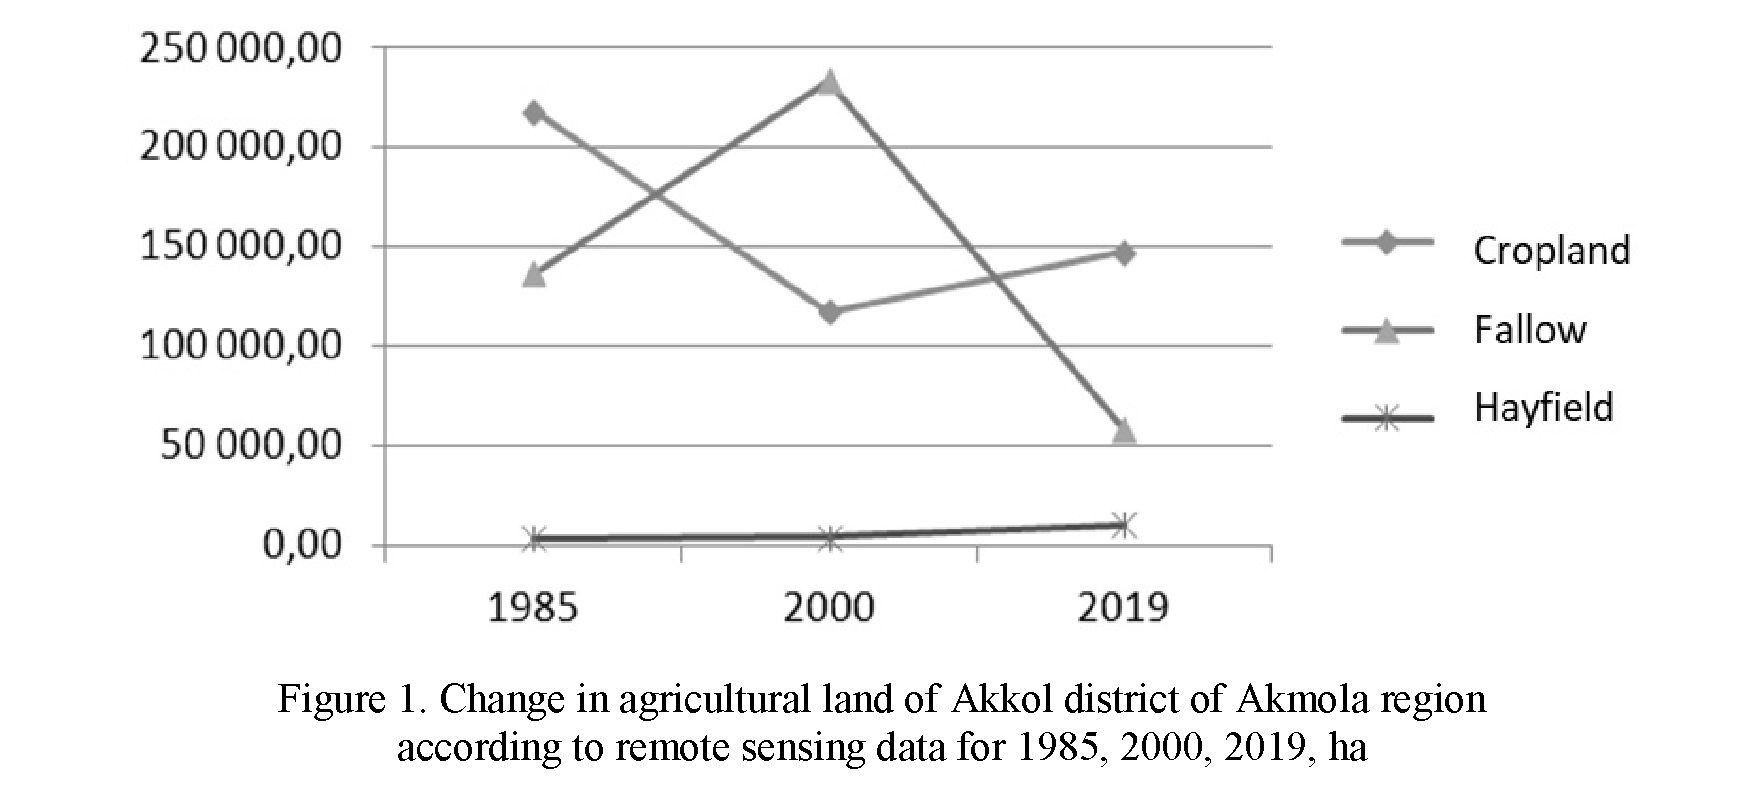
An analysis of land use according to remote sensing data showed that, for example, in the Tselinograd district of Akmola region, during the period from 1985 to 2019, the area of arable land decreased significantly (by 29.7 %). At the same time, the rate of change in different years differed, so until 2000 the decrease was approximately 11 %, from 2000 to 2019 — about 22 % (Fig. 1).
The same pattern of arable land change is noted in the North Kazakhstan region; there is a decrease in arable land over a period of 35 years at 32.5 %. It is worth mentioning that the minimum value of arable land was observed in 2000, after which numbers gradually increased.
Depending on production influence and anthropogenic stress, a change in the soil map content after adjustment is possible by 20–25 %, taking into account a change in the area of arable land, maintenance of pasture and hayfields, involvement of the forest fund in crop rotation, degradation processes, such as the development of ravines, desertification, changes in agricultural land productivity, etc.
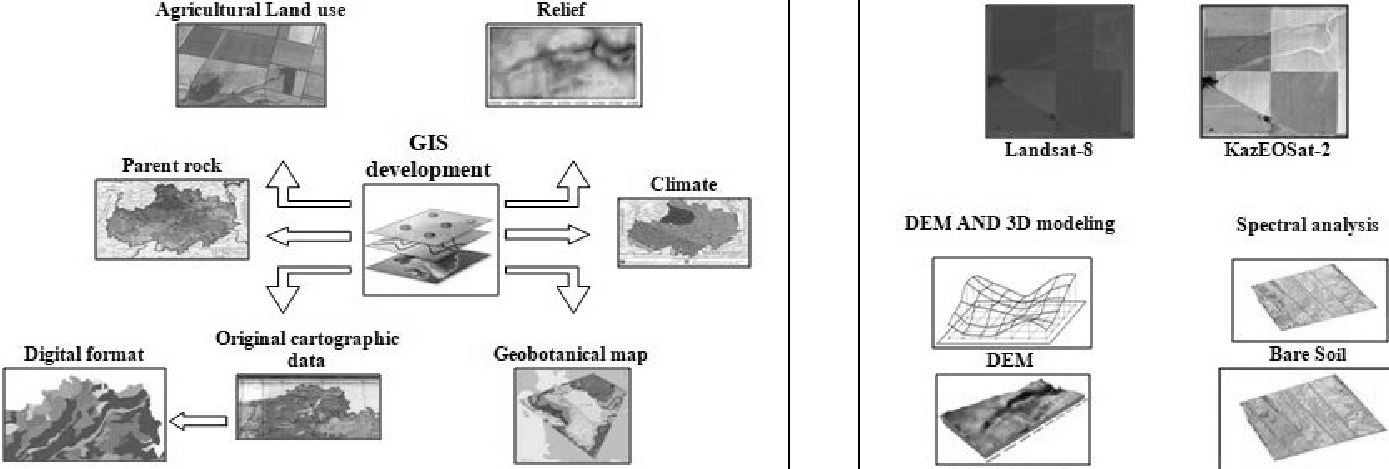
A digital soil map that is designed considering the spatial analysis of the geomorphological structure, relief and degree of agricultural development intensity has several advantages over paper maps due to the use of geoinformation design methods, analysis of relevant remote sensing data, accounting and collection of various parameters in the database [9]. Preliminary model of the relevant soil map was compiled based on the analysis of primary materials — the digitized soil map obtained from the soil survey and Earth remote sensing data [10].
The map was obtained by digitizing the boundaries of soil allotments using the ArcGIS 10.2 software. Based on the results of the digitized soil map of the North Kazakhstan and Akmola region, an experimental digital map was developed. Digital map's format allows expanding access to information available and provides additional opportunities for its analysis. Relevance of the soil contours and the accuracy of the boundaries were controlled by the visual interpretation of the remote sensing data from the KazEOSat-2 spacecraft. As a result, topologically correct map of the structure of soil cover of the area of interest was created, where each soil plot was allocated. The next stage of work is to fill in the attribute database of the vector layer including the full name of the soil combination, particle size distribution, relief type, etc.
Visual analysis of remote sensing data (KazEOSat-1, Sentinel-2) revealed the landscape situation of the territory. First of all, micro-depressions, negative landforms, saucer-shaped depressions, floodplain soils were interpreted. Decryption was conducted by overlaying satellite images with the layer of a digitized soil map, also with DEM if necessary and with the consideration the relevant conclusions about the relationship of landscape conjunction to the soil structure.
Considering that North Kazakhstan belongs to the grain-growing region of the country, therefore area of interest is mainly occupied by arable land, and interpretation was conducted with the help of geographic information design technologies, using information components such as spectral characteristics of the soil cover, DEM, digital soil map of the area of interest and landscape relationships, particularly, with a relief and its parameters: shapes and their elements, steepness and exposure of slopes. According to high-resolution remote sensing data, erosion formations (ravine network, grooves), a microrelief with pronounced soil hydromorphism, and also the complexity of the structure of the soil cover in the form of a spotted image of arable land are revealed. Based on the results of image interpretation, it is important to note that with a high complexity of the soil cover, high-resolution remote sensing data are the necessary tool for the accurate determination of the location, boundaries and sizes of ranges of different components in the complex structure of the soil cover.
Multi-temporal remote sensing data were used for the analysis; the ravine-girder network, high moisture content in micro-depressions and the effusion of salts on the soil surface are well interpreted from spring images. Based on summer images, interpretation was conducted by indirect criteria (heterogeneity of the vegetation cover «bald patches» and low amount of biomass) using the analysis of spectral dependences.
According to remote sensing data, about 36 soil varieties were interpreted in the test site of the Akmola region, while on the original soil map 7 zonal types were mapped, the average area of the soil variety decreased from 35,738.8 ha to 6793.9 ha, whereas according to remote sensing data soil ranges less than 10 ha.
Based on remote sensing data, about 30 soil varieties were detected in the test site of the North Kazakhstan region, while on the original soil map 7 zonal types of soils were mapped, the average area of the soil variety decreased from 35,798.8 ha to 8,354.4 ha and at the same time according to remote sensing data soil areas reveals to be less than 10 ha. Standard soil ranges have homogeneous processes of genesis and soil formation factors, which are characterized by one type of topography, parent rocks, a similar type of vegetation cover, climatic conditions and one type of agricultural land use.
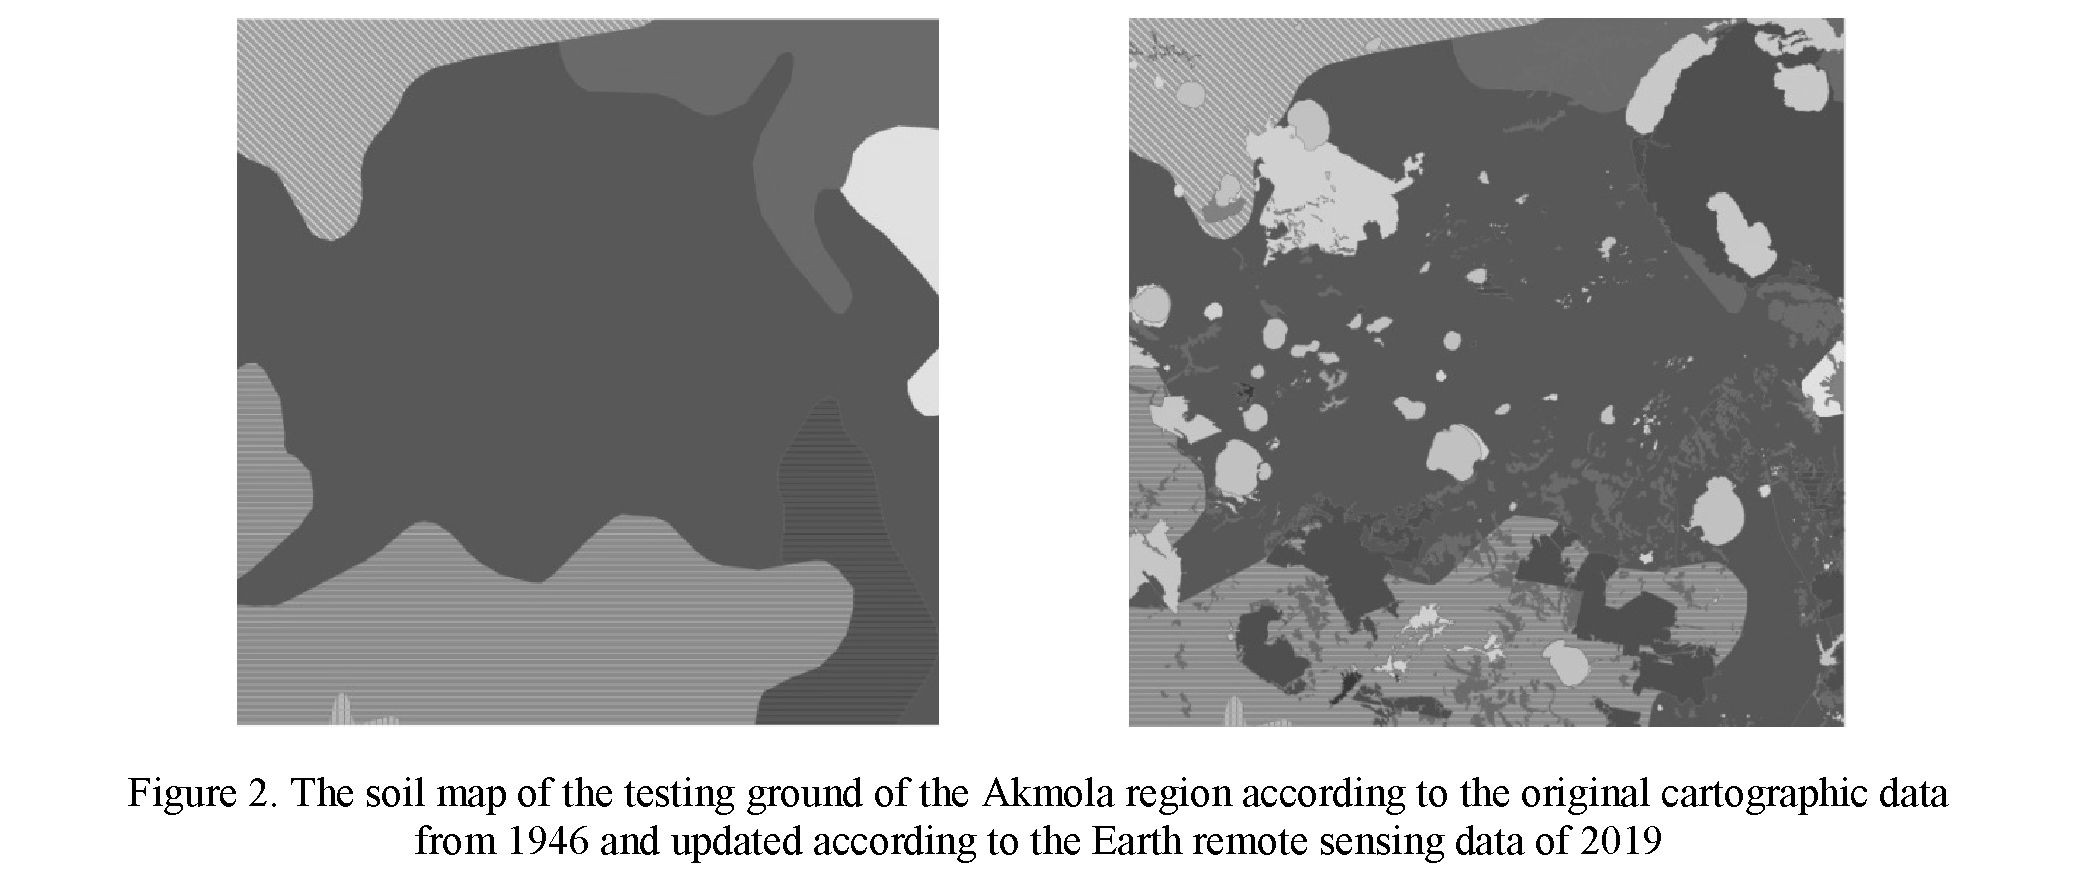
The soil map of the study area includes about 30 soil varieties that belong to 11 different soil types. Comparison with the map of 1946 revealed that the boundaries of the main soil types in this territory did not undergo significant changes, but using geoinformation design combined with a high-resolution image and a high-quality topographic base, it was possible to refine the contours of the generic and species varieties of soils of the region (Fig. 2).
Thus, an analysis of land use according to remote sensing data of the territory of Northern Kazakhstan showed that during the period from 1985 to 2019 the area of arable land decreased significantly (about 30 %), this is the cause for making adjustments to the content of the soil map. According to remote sensing data, about 30 soil varieties in North Kazakhstan and 36 varieties in Akmola region were interpreted at test sites with an area of 2500 square km, therefore it can be stated that using remote sensing data details of soil map has been enhanced up to 23 %.
One of the stages of digital soil mapping is the thematic processing of remote sensing data with the classification and indexing of the area of interest. The spectral response of soils according to remote sensing data in different seasons bears its own part of informativeness. The classification of the area of interest during spring period with an open surface contributes to the identification of homogeneous soil areas with a similar lithological, granulometric, and morphometric structure. There is a clear interpretability of such features as humus, moisture, salinity, etc. The different density and biomass of vegetative plants indicates the variability of the original soil fertility and the type of soil habitats. Vegetation as an indirect criteria serves as an indicator of soil cover. In this case, the images are informative during the period of maximum growth and development (July). Thematic processing of images with the allocation of classes and the calculation of vegetation indices contributes to the identification of soil heterogeneities and interpretation of the main soil polygons.
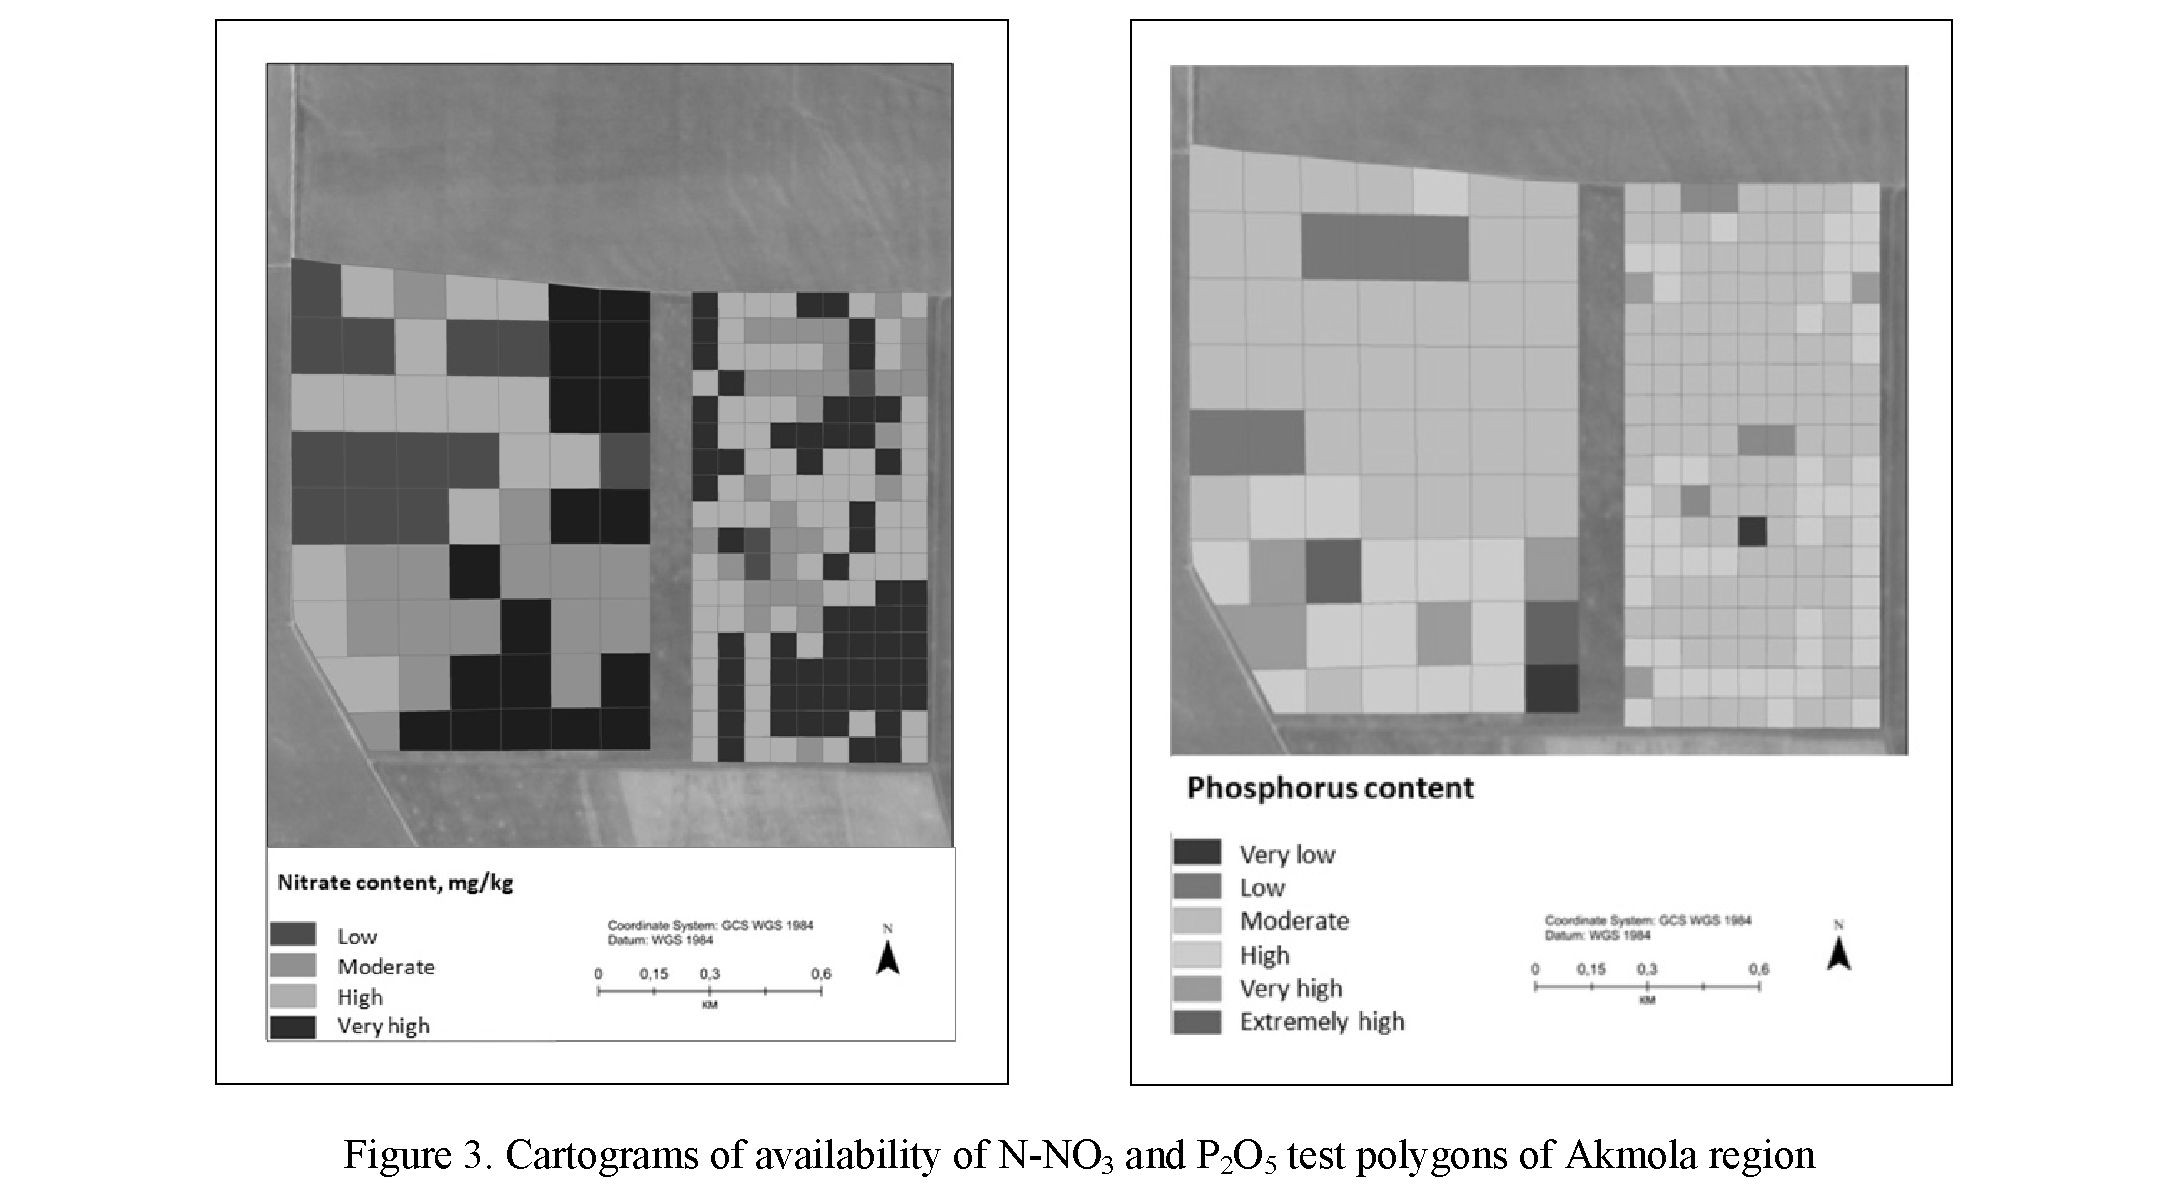
Studies for determination the relationship between the content of macronutrients in the seed layer of the soil and the value of the vegetation index were carried out on the test polygon of the Akmola region. For soil sampling the area of 1 ha became the standard soil site of the first test polygon, the number of polygons were 162, the area of the standard soil polygon for sampling at the second test polygon was 5 ha, the total number polygons were 62 (Fig. 3).
Soil samples for determining the content of nitrate nitrogen and mobile phosphorus were taken in the pre-sowing period (mixed from 5 samples) from each polygon.
A regression analysis was carried out between the values of the derivatives of vegetation indices and the values of the N-NO3 and P2O5 content in the sowing layer to determine the cause-effect relationship and further study the spatial distribution and dynamics of soil properties.
For a full assessment of the dependences, Sentinel-2 images were examined for the spring period with an open soil surface for May 3th, May 8th, May 13th, May 15th of 2019, for the summer period of July 7th, July 12th, July 17th, July 19th of 2019 at the period of its maximum growth and development. Thematic processing of remote sensing data was conducted and the calculation of spectral indices NDWI (Normalized Difference Water Index), NDVI (Normalized Difference Vegetation Index), GNDVI (Green Normalized Difference VI), GDVI (Generalized Difference VI), SAVI (Soil Adjusted VI), Bare Soil (bare ground index).
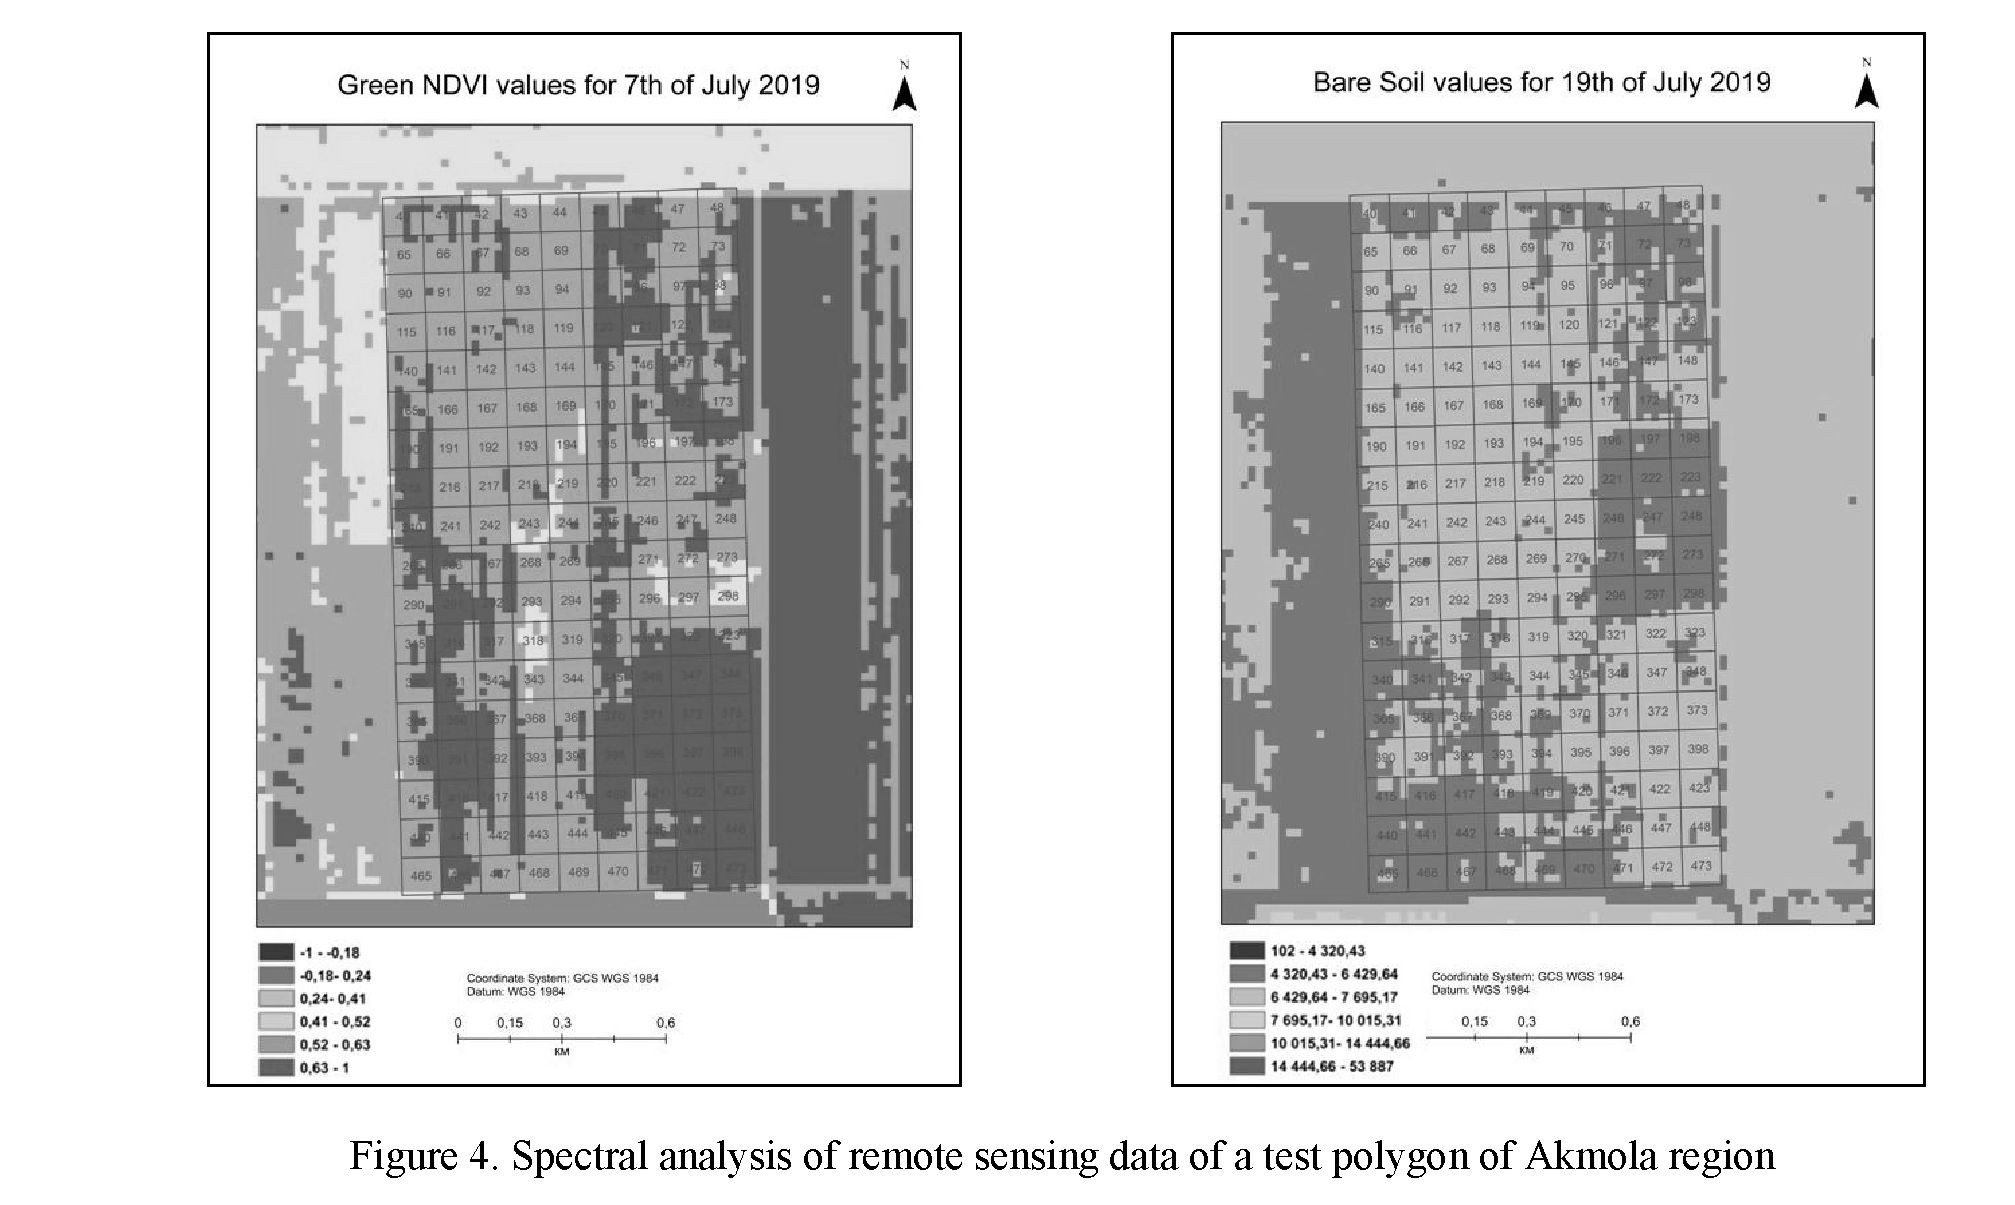
Below are the results of studies of a sampling polygon with an area of 1 ha (Fig. 4). The determination coefficient R of the values of the Bare Soil index and the content of nitrate nitrogen in the seed layer of the soil on July 19th reaches 0.4. The values of the GNDVI index and the content of mobile phosphorus for the determination coefficient R for July 7th reaches 0.5. This means that according to the Cheddock scale, the relationship between the indicators is moderate.
A statistical analysis of the influence of the content of macronutrients in the sowing layer on the spectral image, obtained from remote sensing data, did not reveal a significant dependence, the degree of values variation determinism is below average.
During the period of the maximum development of crop plants, the Bare Soil index is the most informative in terms of the nitrogen content in the soil — this is an indicator where the short-wave infrared and red spectral ranges are used to quantify the mineral composition of the soil, according to the content of nitrate nitrogen — GNDVI, the blue and near infrared spectral ranges are used to enhance the presence of vegetation.
Thus, for the conditions of 2019, a moderate dependence of the values of N-NO3 and P2O5 in the sowing layer and the Bare Soil and GDVI indices, respectively, was observed for an area of 1 ha, i.e. with thematic processing of satellite images during the period of maximum growth and development of crop plants, it is possible to allocate areas of nutrients availability by marked changes in the spectral substrate.
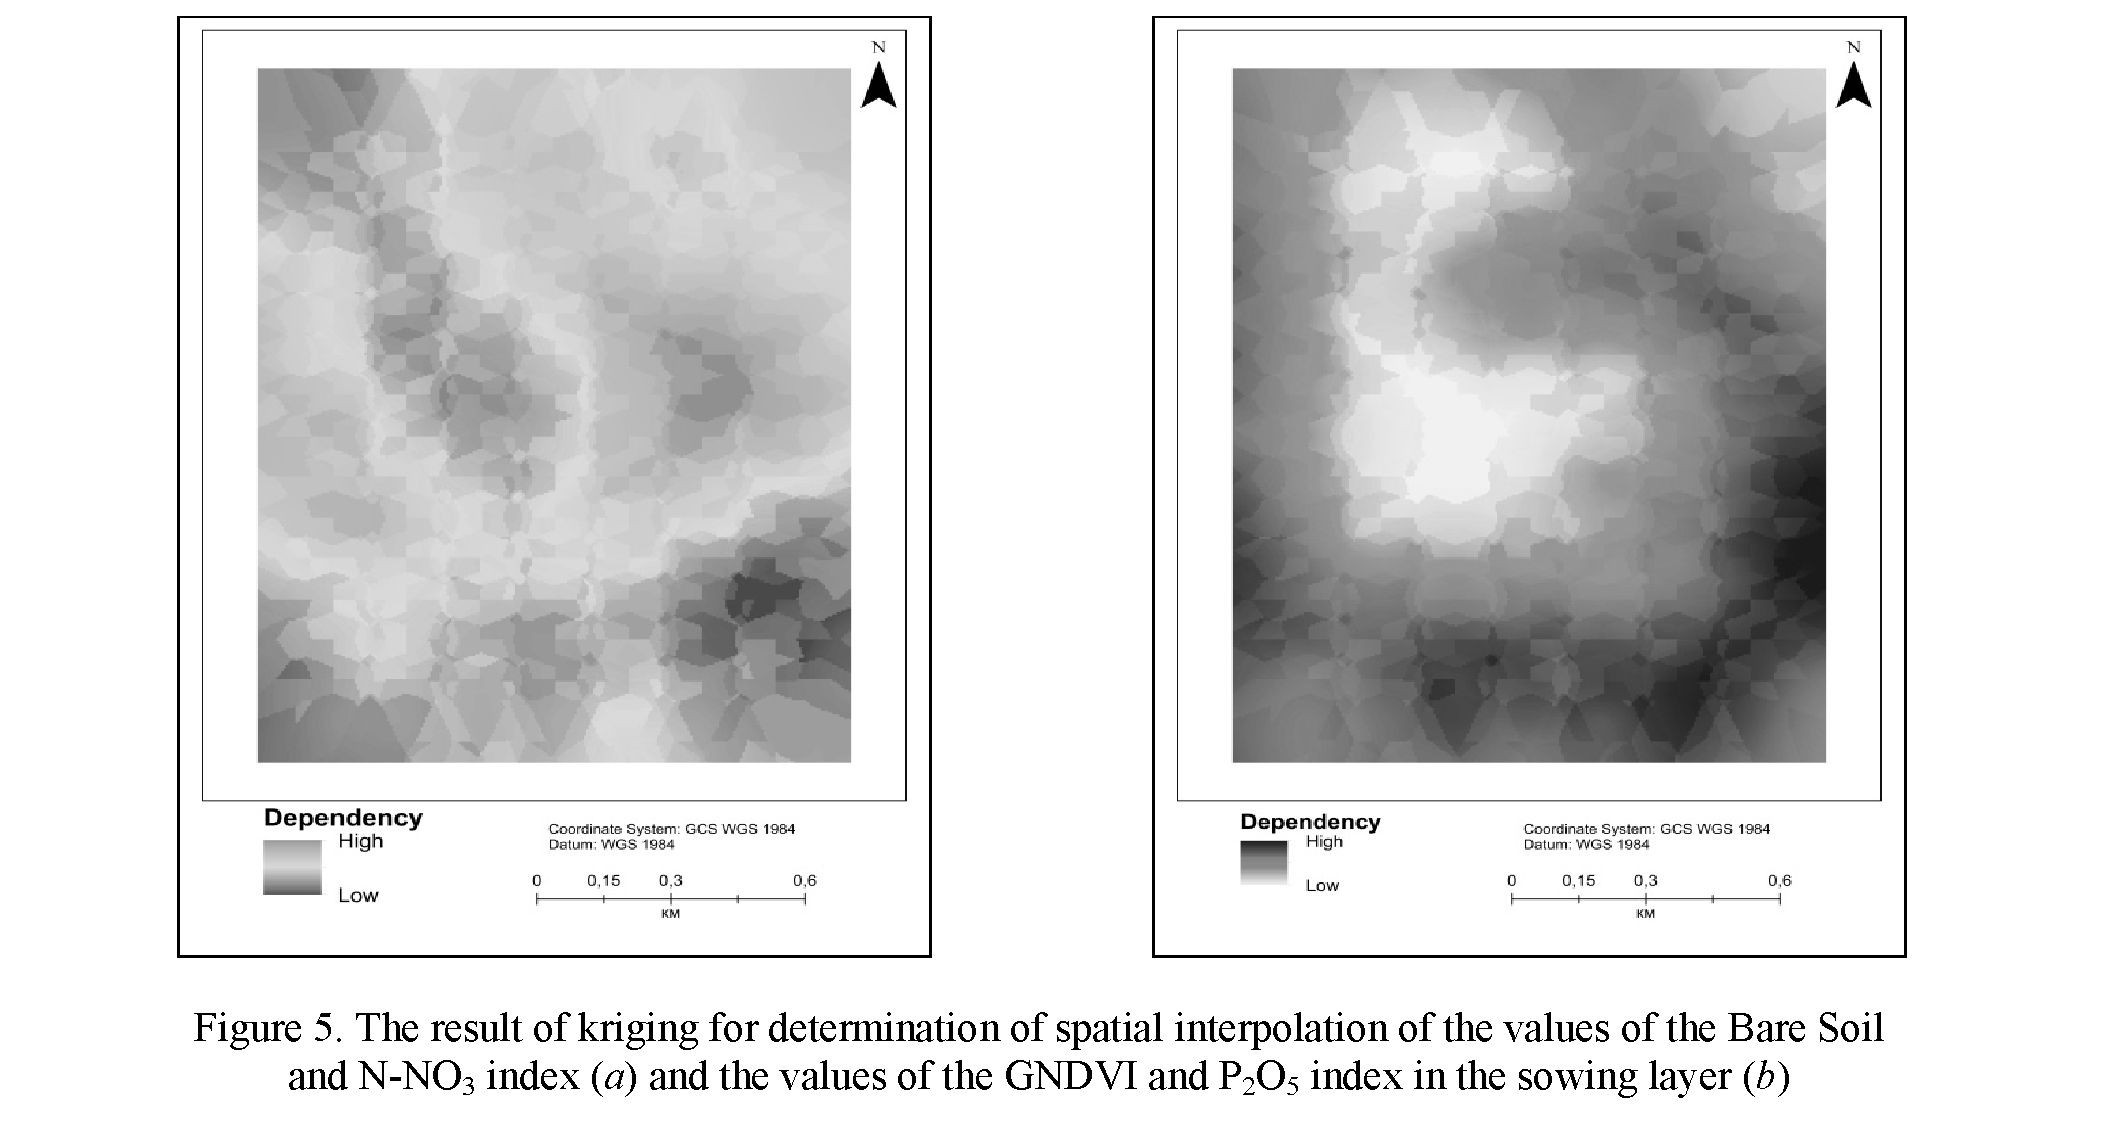
The kriging method is well-known to study spatial interpolation of values, based on the variogram model, which determines the values of a variable of the requested point or region (Webster, 2008). The term «kriging» unites a whole family of spatial regression algorithms.
Estimation of dependencies of kriging methods is more smoothed in comparison with distribution of source data. In a statistical regard kriging is the best estimator in the class of linear interpolators because its assessment has a minimal error variation. An important property of kriging is the accurate reproduction of measurement values of existing points. Obtained error allows us to characterize the uncertainty of the data estimation using confidence intervals.
The result of spatial analysis of the index values content and the values of the main nutrient element in the sowing layer is probability maps of variability by a factor that changes due to the relative dependence of factors from low to high. The next task of the research is to find out the reasons that contribute to the manifestation of a strong dependence of the index value and the content of nutrients.
Kriging enables to carry out probabilistic mapping of the level of a spatial variable such as the content of nutrients in the sowing layer of the soil and the accuracy depends on the correct selection of the timing of the space survey and the spectral index (Fig. 5).
Thus, for the conditions of 2019, a moderate dependence of the values of N-NO3 and P2O5 was observed in the sowing layer and the Bare Soil and GDVI indices, respectively for an area of 1 ha, i.e. using thematic processing of satellite images during the period of maximum growth and development of cultivated plants, it is possible to identify zones of supply with nutrients by pronounced changes in the spectral substrate.
Conclusion
The presented result shows the possibility of revealing the factor dependence of the formation of soil cover through spatial data, distance information and characteristics of the relief. On the geoinformation platform, a digital field is being formed for mapping soils, where an analytical and integrated approach is reflected for consideration of all the factors of soil formation and economic activity. Using a model for accounting soil resources, designed on the basis of geospatial information, it is possible to verify cartographic material for large areas, map correction with a consistent increase in scale, the extraction of analytical information, detailing for individual territories, etc. [6].
Figure 6. Algorithm for soil analysis based on remote sensing data, geoinformation design
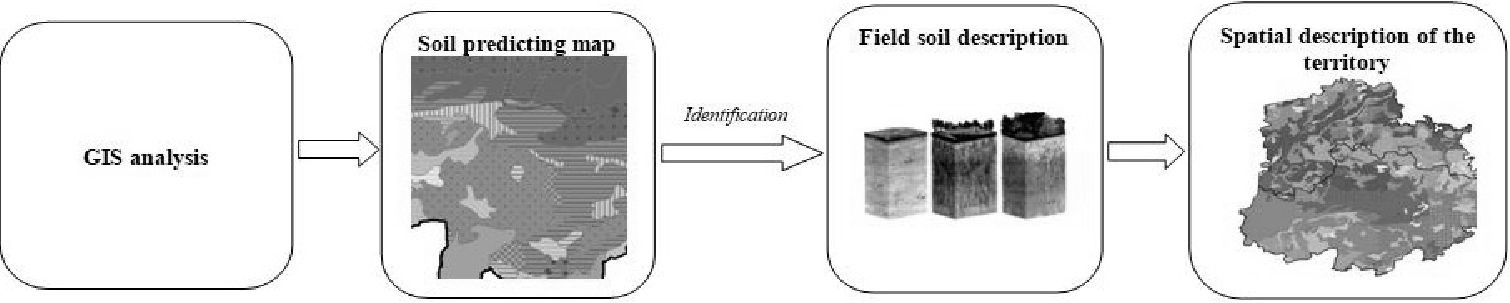
Based on the results obtained, it is possible to construct an algorithm for analyzing the soil cover based on remote sensing data, geoinformation design, DEM and original soil maps in vector format.
The need for the introduction of new methods of soil mapping is determined by the high level of production influence and anthropogenic stress, which contributes to a change in the content of the soil map after adjustment by 20–25 %.
Using remote monitoring methods allows practical application of digital soil mapping at the regional level. The digital soil mapping algorithm presented below uses satellite data as the main source of information (Fig. 6). During the validation and verification processes of some methods points will be clarified in further research work. The need for further research on the capabilities of soils interpretation, developing a methodological justification, and adapting the indicator features of soils to a digital format determines the future direction of the work.
Financing
The results presented in the article were obtained within the framework of the implementation of the Republican budget program 008 No. BR0533648 / EFP «Optimization of technical parameters and a methodological approach to the use of remote sensing data of domestic satellite KazEOSat — 1,2 «Subpro- gram 1» Development of scientific methods for evaluating soil fertility of North Kazakhstan on the basis of the Earth remote sensing data from KazEOSat — 1,2 satellites and geoinformation technologies».
References
- Savelev, A.A., Grigor'yan, B.R., Dobrynin, D.V., Muharamova, S.S., Kulagina, V.I. & Sahabiev, I.A. (2012). Otsenka pochvennoho plodorodiia po dannym distantsionnoho zondirovaniia Zemli [Assessment of soil fertility according to Earth remote sensing data]. Uchenye zapiski Kazanskoho universiteta. Estestvennye nauki — Scientific notes of Kazan University. Natural Sciences, 154, 3, 158–172 [in Russian].
- Kiselev, A.S., & Marinina, O.A. (2009). Ispolzovanie dannykh DZZ iz kosmosa dlia identifikatsii zahriaznennosti pochv [Use of the ERS data from space for identification of soil contamination]. Geoprofi, 3, 28–33 [in Russian].
- Broge, N.H., & Leblanc, E. (2000). Comparing prediction power and stability of broadband and hyperspectral vegetation indices for estimation of green leaf area index and canopy chlorophyll density. Remote Sensing of Environment, 76, 156–172.
- Stolbovoi, V., & McCallum, I. (2002). Land Resources of Russia. International Institute for Applied Systems Analysis and the Russian Academy of Science.
- Ustin, S.L., Roberts, D., Gamon, J.A., Asner, G.P., & Green, R.O. (2004). Using Imaging Spectroscopy to Study Ecosystem Processes and Properties. BioScience, 54, 6, 523–534.
- Krenke, A.N. (2012). Korrektsiia pochvennykh kart na osnove dannykh distantsionnoho zondirovaniia i tsifrovykh modelei relefa [Correction of soil maps based on remote sensing data and digital elevation models]. Tsifrovaia pochvennaia kartohrafiia: teoreticheskie i eksperimentalnye issledovaniia — Digital soil mapping: theoretical and experimental research, 287–304 [in Russian].
- Sbornik statei [Digest of articles]. (2012). Pochvennyi institut imeni V.V. Dokuchaeva — Soil Science Institute named after V.V. Dokuchaev, 287–304 [in Russian].
- Savin, I.Yu. (2016). Ispolzovanie sputnikovykh dannykh dlia sostavleniia pochvennykh kart: sovremennye tendentsii i problemy [Using satellite data to compile soil maps: current trends and problems]. Sovremennye problemy distantsionnoho zondirovaniia Zemli iz kosmosa — Modern problems of remote sensing of the Earth from space, 13, 6, 29–39 [in Russian].
- Korolyuk, T.V. (2012). Pochvennaia interpretatsiia kosmicheskikh izobrazhenii v sisteme metodov CPK [Soil interpretation of space images in the system of CPC methods]. Tsifrovaia pochvennaia kartohrafiia: teoreticheskie i eksperimentalnye issledovaniia — Digital soil cartography: theoretical and experimental research. — Moscow: Soil Science Institute named after V.V. Dokuchaev [in Russian].
- Redkov, V.V., & Storozhenko, D.M. (1958). Pochvennaia karta Akmolinskoi oblasti KazSSR [Soil map of the Akmola region of the Kazakh SSR] [in Russian].