In this study it has been aimed to determine the tourism perception of residents and what should be done to develop tourism in Turkestan. A questionnaire prepared for this purpose was conducted to residents by the method of simple random sampling. According to questionnaire results obtained from 940 people, it is found that residents in Turkestan define tourism as an activity which provides economic development and they define tourist as person who brings currency. Respondents intensely indicate that in Turkestan existing facilities should be enhanced and service quality should be increased. Moreover, as a result of the analysis of the obtained data, seven factors related to residents’ tourism perception and their attitudes towards tourism have been identified. When the average of these factors in terms of education, monthly income and nationality of residents was taken into account, significant differences have been found. The study is significant in that it is the first study carried out specifically in Turkestan and in this scope.
Tourism is accepted as the easiest way to increase the life standard of a region and to strengthen the economy of residents. Urban and regional planners, industry and sector representatives, non-governmental organizations, and municipal corporations are responsible for providing the true development of the region and residents under the existing conditions [1].
Tourists are foreigners for the residents, residents are also foreigners for tourists. Interaction between tourists and residents can occur in different environments and ways. Travel vehicles, hotels, restaurants, shopping centres, sightseeing areas are the areas where tourist and residents meet most. M. Tezcan and P.Rocharungsat summarize the conditions that could result from the interactions between tourists and residents as follows [2, 3]:
- Cultural transmission which results from mutual expressions of the distinctive cultures of tourists and the residents peoples,
- Cultural diffusion which occurs as changes in traditions and customs, attitudes and values, religious structure and language as a result of cultural transmission,
- Cultural shock which results from considerable cultural discrepancies between two cultures,
- Cultural degeneration which results from losing one’s culture with change,
- Cultural conflict that implies the reaction of the residents to strange behaviours of tourists. Determining the attitudes of the residents related to the current development of tourism, preventing possible negative effects, and increasing effects that could be positive are vital to ensure sustainable development [4].
Negative experiences resulting from merely profit-oriented tourism activities could lead to impairing or the end of the efforts to develop tourism by the residents. However, measuring the reaction of the residents to these activities in advance could be enlightening for tourism planners. Negative social effects can be reduced, and alternatives can be increased, if tourism planners know the reasons why residents support or oppose tourism [5].
Recently, many tourism regions and shareholders of these regions have started to acquire information about the attitudes of the residents towards tourism sector and its development. The reasons for this is that they desire to benefit more from the global tourism market, increase the number of tourists that come to the region, and ensure residents’ participation in sectorial investments and the decision making process [6]. In line with this, the research aims to examine tourism from the viewpoint of the residents and to determine the requirements for tourism development in Turkestan.
A wide range of studies on the residents’ perceptions of tourism are available. In this part, relevant studies carried out in recent past have been analysed. In their research on Isparta residents’ tourism perspective, Doğan and E. Üngören found out that approximately 50 % of the residents do not have enough information on the natural and cultural beauties they have in the region, and Isparta has some problems related to infrastructure [7]. They have also found out that Isparta residents believe that there is no efficient and adequate coordination regarding tourism among the leading organizations and provincial departments; they also believe that tourism investments should be increased to improve tourism in Isparta. In the study it is also emphasized that when tourism development is provided, economic and socio cultural development gain acceleration.
Furthermore, M. Özdemir and I. Kervankıran examined the attitudes of Afyonkarahisar residents towards tourists and tourism [8]. The results of the study revealed that most of the residents take a positive attitude towards the processes of tourism development in the city; and they believe that tourism investments should increase, as the natural, historical and cultural potentials of the city are appropriate for tourism development. According to the majority of the respondents, tourism has a significant impact in the recovery and socio cultural development of the city. Nonetheless, tourism development has also resulted in some negative environmental impacts in the city.
- Giritlioğlu and E. Bulut researched tourism in accordance with the perspectives of Gaziantep residents. The results reveal that the residents regard tourism positively, and emphasize that activities of promotion and advertising should be increased, and historical buildings should be resorted in order to maintain the sustainability of tourism [9]. In his research, L.Toprak examined Mardin residents’ perceptions of tourism. The results reveal that Mardin residents take a positive attitude towards tourism; and that they pay the most attention to economic impacts of tourism whereas social and environmental impacts are paid less attention [10].
- Dyer et al. intended to develop a structural model that identified residents’ perceptions of tourism and how these perceptions influenced Sunshine Coast residents in terms of supporting tourism development. The results yield five factors which are negative social-economic impacts, positive social impacts, negative social impacts, positive economic impacts, and positive cultural impacts [11]. Besides, they have found out that the factor of perceived positive economic impacts has the most significant portion in residents’ support for tourism development. Additionally, R. Harrill carried out researches to determine the significance of residents’ attitudes in the process of tourism development while A. Besculides et al. carried out researches in residents’ perceptions of the cultural impacts of tourism [12, 13].
In order to gather data on residents’ perspectives of tourism in Turkestan, a scale is prepared benefiting from the scales of H. Doğan and E. Üngüren [7]. In order to determine the reliability of the questions in the attitude scale of Tourism Perceptions and Attitudes towards Tourism, the internal consistency coefficient, Cronbach’s Alpha, is calculated and found high (α=0.743). After determining the reliability of the questionnaire questions as adequate, and finalizing the questionnaire forms, 1000 questionnaires were conducted in October, 2015, by means of simple random sampling method. The questionnaires were handed out in person to civil servants, housewives, shoppers and sellers in the markets of Turkestan, citizens relaxing at parks, and students at schools. After filling in the questionnaires, they were taken back from the residents without any delay.
After removing the incomplete and incorrect questionnaires, 940 questionnaires are considered suitable to be used in the research. The data are analysed using the Statistical Package for Social Sciences (SPSS) software version 22.0 for Windows, which allows for the generation of percentages and descriptive statistics (i.e. frequency, mean scores, and the standard deviation). In order to compare continuous quantitative data between two independent groups, t-test is used. Likewise, in order to compare continuous quantitative data between more than two independent groups, one-way Anova test is used. After one-way Anova test, Scheffe’s Method as a post-hoc analysis is used in order to determine the differences. The findings are evaluated in a 95 % confidence interval, and 5 % level of significance.
In order to determine the reliability of the questions in the Perceptions and Attitudes towards Tourism scale, Cronbach’s Alpha is calculated, and found high (α= 0.743). Exploratory factor analysis is applied in order to reveal the construct validity of the scale. As a result of Barlett’s test, the P value is computed as p=0.000<0.05; and it is ascertained that there is a correlation between the variables computed in the factor analysis. The KMO (Kaiser-Meyer-Olkin) value is computed as 0,801. Moreover, it is ascertained that the sample size is adequate for the factor analysis. By choosing varimax rotation in factor analysis, it is ensured that the structure of the correlation between the factors remain unchanged. As a result of the factor analysis, the variables are categorized into 7 factors with an explained variance total ratio of 63.25 %, as shown in Table 1.
In the evaluation process of Residents’ Perceptions and Attitude towards Tourism Scale, the factors with Eigenvalues that are bigger than one are chosen. Meanwhile, a particular attention is paid to the high factor loadings that indicate the weight of variables in the factors. Additionally, a great effort is made so as not to have similar factor loadings for the same variable. The high values of the factors’ reliability coefficient that form the scale, and the high values of the total explained variance ratios indicate a scale with a strong factorial structure.
T a b l e 1
Factorial Structure of Residents’ Perceptions and Attitudes towards Tourism Scale
|
Factor 2: Lack of Tourism Consciousness in Residents and Administrators |
|
|
|
|
|
|
|
|
|
Turkestan residents are not conscious of tourism |
|
|
|
0,793 |
|
|
|
|
|
Residents do not give sufficient attention towards tourism |
|
|
|
0,752 |
|
|
|
|
|
Promotion of the touristic values of Turkestan is insufficient |
|
|
|
0,748 |
|
|
|
|
|
Cooperation, communication and coordination between fundamental institutions and agencies of Turkestan are insufficient in terms of tourism development |
|
|
|
0,642 |
|
|
|
|
|
Factor 3: Belief in the Contribution of Tourism |
|
|
|
|
|
|
|
|
|
I believe tourism would make a great contribution to the economy of Turkestan |
|
|
|
0,830 |
|
|
|
|
|
Tourism investments should primarily increase to develop tourism in Turkestan |
|
|
|
0,821 |
|
|
|
|
|
For the success of tourism, residents and all segments of society should participate |
|
|
|
0,757 |
|
|
|
|
|
Factor 4: Social and Environmental Damage |
|
|
|
|
|
|
|
|
|
Foreign tourists negatively influence the residents |
|
|
|
0,816 |
|
|
|
|
|
Domestic tourists negatively influence the residents |
|
|
|
0,768 |
|
|
|
|
|
Tourism destroys nature |
|
|
|
0,536 |
|
|
|
|
|
Tourism creates noise and pollution |
|
|
|
0,474 |
|
|
|
|
|
Factor 5: Negative Cultural Impacts |
|
|
|
|
|
|
|
|
|
Tourism is likely to change our traditions and customs |
|
|
|
0,818 |
|
|
|
|
|
Tourism is likely to have negative impacts on our children and teenagers |
|
|
|
0,746 |
|
|
|
|
|
Tourism is likely to increase bad habits (alcohol, gambling, etc.) |
|
|
|
0,587 |
|
|
|
|
|
Factor 6: Tourism Potential of Turkestan |
|
|
|
|
|
|
|
|
|
Mausoleum of Khoja Akhmet Yassawi is a tourist attraction that could develop tourism in Turkestan all by itself |
|
|
|
0,703 |
|
|
|
|
|
Turkestan possesses a rich potential in tourism area |
|
|
|
0,674 |
|
|
|
|
|
Tourism development creates more jobs in Turkestan |
|
|
|
0,637 |
|
|
|
|
|
Turkestan cannot use its tourism potential sufficiently |
|
|
|
0,569 |
|
|
|
|
|
Factor 7: Negative Impacts of Tourism on Daily Life |
|
|
|
|
|
|
|
|
|
Tourism is likely to result in traffic congestion |
|
|
|
0,781 |
|
|
|
|
|
Tourism is likely to result in unpleasant over crowdedness |
|
|
|
0,773 |
|
|
|
|
|
Eigenvalue |
5.092 |
3.463 |
1.870 |
1.671 |
1.436 |
1.238 |
1.043 |
|
|
% of Total Variance |
13.82 |
9.38 |
8.92 |
8.23 |
8.19 |
7.80 |
6.88 |
|
|
Cronbach’s Alpha |
0.860 |
0.750 |
0.811 |
0.729 |
0.688 |
0.633 |
0.692 |
|
|
% of Total Variance Explained |
63.25 |
|||||||
|
The Kaiser–Meyer–Olkin measure of sampling adequacy |
|
|
|
0.801 |
|
|
|
|
|
The Bartlett's test of sphericity (significance level) |
p=0.000 |
|||||||
Note. Calculated in the SPSS program by authors.
Table 2, which shows general attributes of the respondents, indicates that most of the respondents are between the ages 18-30 (36.1 %), have undergraduate degree (38.7 %) and most of them are women (55.4 %). It is found out from the Table 3 that respondents who mainly live between 11-20 years in Turkestan form 36.1 %; respondents whose monthly income are less than 100 $ form 33 %, respondents who are civil servants form 25.4 %, respondents who are Kazakh form 63 %.
T a b l e 2
Findings regarding Control Variables
|
Residency in Turkestan |
n |
% |
Gender |
n |
% |
|
10 years and less |
39 |
4.1 |
Female |
521 |
55.4 |
|
11-20 |
339 |
36.1 |
Male |
419 |
44.6 |
|
21-30 |
302 |
32.1 |
Total |
940 |
100.00 |
|
31-40 |
171 |
18.2 |
Educational Backgrounds |
n |
% |
|
40 + |
89 |
9.5 |
Elementary Education- |
187 |
19.9 |
|
Total |
940 |
100.00 |
High School |
290 |
30.9 |
|
Age |
n |
% |
University |
364 |
38.7 |
|
Under 18 |
39 |
4.1 |
Graduate |
99 |
10.5 |
|
18-30 |
339 |
36.1 |
Total |
940 |
100.00 |
|
31-40 |
302 |
32.1 |
Monthly Income ($) |
n |
% |
|
41-50 |
171 |
18.2 |
Under 100 |
310 |
33.0 |
|
Over 50 |
89 |
9.5 |
100-200 |
301 |
32.0 |
|
Total |
940 |
100.00 |
200-400 |
281 |
29.9 |
|
Nationality |
n |
% |
Over 400 |
48 |
5.1 |
|
Kazakh |
592 |
63.0 |
Total |
940 |
100.00 |
|
Kyrgyz |
40 |
4.3 |
Occupation |
n |
% |
|
Uzbek |
201 |
21.4 |
Workers |
196 |
20.9 |
|
Azeri |
20 |
2.1 |
Civil Servants |
242 |
25.7 |
|
Turkish |
19 |
2.0 |
Retired People |
85 |
9.0 |
|
Turkmen |
21 |
2.2 |
Housewives |
136 |
14.5 |
|
Tatar |
15 |
1.6 |
Students |
161 |
17.1 |
|
Russian |
25 |
2.7 |
Others |
120 |
12.8 |
|
Others |
7 |
0.7 |
Total |
940 |
100.00 |
|
Total |
940 |
100.00 |
|
|
|
Note. Calculated in the SPSS program by authors.
According to Table 3, Turkestan residents answer the question «Do you go on holiday?» mostly (80 %) as «yes».
T a b l e 3
Travel Habits of Turkestan Residents
|
Opportunity to go on Holiday |
n |
% |
Holiday Destination |
n |
% |
|
No |
188 |
20.0 |
Kazakhstan |
406 |
54.0 |
|
Yes |
752 |
80.0 |
Abroad (Neighbouring Countries) |
242 |
32.2 |
|
Total |
940 |
100.00 |
Turkey |
45 |
6.0 |
|
Frequency of Going Holiday |
n |
% |
Europe |
32 |
4.3 |
|
Every Year |
184 |
24.5 |
Others |
27 |
3.6 |
|
Rarely |
568 |
75.5 |
Total |
940 |
100.00 |
|
Total |
940 |
100.00 |
|
|
|
Note. Calculated in the SPSS program by authors.
However, most of the respondents (75.5 %) do not go on holiday regularly and most of them (54 %) travel inside Kazakhstan.
When they travel abroad, they mostly prefer neighbouring countries due to the fact that Turkestan is close to Uzbekistan and Kyrgyzstan, and there are highway and rail transportation facilities. Table 4 indicates that respondents’ most common answer to the question of «What is tourism?», which is a multiple answer question and asked to evaluate how Turkestan residents identify tourism, is «an activity that develops economy» (45 %). Considering the overall variance, it can be asserted that their answers concentrate on positive definitions of tourism. The least marked answer is «an activity that sets other sectors back» (1.3 %)
T a b l e 4
Tourism Perceptions of Turkestan Residents
|
What is Tourism? |
Frequency (n) |
Percentage (%) |
|
Tourism is an activity which develops economy |
423 |
45.0 |
|
Tourism is an activity which improves culture |
264 |
28.1 |
|
Tourism is an activity which provides interaction among people |
237 |
25.2 |
|
Tourism is an activity that improves the landscape |
228 |
24.3 |
|
Tourism is an activity that protects nature, history and cultural values |
344 |
36.6 |
|
Tourism is an activity that damages the moral values of the society |
28 |
3.0 |
|
Tourism is an activity that sets other sectors back |
12 |
1.3 |
|
Tourism is an activity that pollutes the environment |
21 |
2.2 |
|
Others |
17 |
1.8 |
Note. Calculated in the SPSS program by authors.
Table 5 shows respondents’ answers to the question of «Who is a tourist?». According to Table, Turkestan residents define a tourist as «a person who brings currency» (48.6 %) whereas the definition that «a person who brings illnesses» is the least marked answer (2.2 %). Evaluating the answers to the question «Who is a tourist?» together with the answers to «What is tourism?», it can be stated that Turkestan residents regard tourism and tourists primarily as economical phenomena.
Turkestan Residents’ Perceptions of Tourist
T a b l e 5
|
Who is a tourist? |
|
Frequency (n) |
Percentage (%) |
|
A person who brings currency |
|
457 |
48.6 |
|
A person who needs help |
|
202 |
21.5 |
|
A person who sets a bad example to the residents |
|
62 |
6.6 |
|
A person who brings illnesses |
|
21 |
2.2 |
|
A person who provides the development of Turkestan |
|
249 |
26.5 |
|
Others |
|
125 |
13.3 |
Note. Calculated in the SPSS program by authors.
Table 6 shows that the respondents’ most common answer to the question is «I would tell the directions if tourists ask them» (36.8 %). The answer «I would welcome tourists in my house» is the least marked answer with a percentage of 7.4 %.
T a b l e 6
Residents’ Communication with Tourists
|
How do you communicate with tourists? |
Frequency (n) |
Percentage (%) |
|
I would tell the directions if tourists ask them |
346 |
36.8 |
|
I would help tourists tour the region |
311 |
33.1 |
|
I would welcome tourists in my house |
70 |
7.4 |
|
I would not communicate with tourists |
177 |
18.8 |
|
Others |
170 |
18.1 |
Note. Calculated in the SPSS program by authors.
According to Table 7, which shows the evaluations on the current tourism facilities, the respondents’ most common answer to the question is «current facilities should be improved and quality should be increased» (36.2 %). The most remarkable result in the table is that the option «tourism facilities are not attractive for me» is marked by a considerable amount of respondents (23.3 %). When this result is evaluated with the «current facilities should be improved and quality should be increased» option, it can be stated that investments are necessary to increase the attractions regarding tourism.
T a b l e 7
Residents’ Perspectives on Turkestan’s Current Tourism Facilities
|
What do you think about Turkestan’s Current Tourism Facilities? |
Frequency (n) |
Percentage (%) |
|
Tourism facilities are not attractive for me |
219 |
23.3 |
|
Tourism facilities are adequate |
234 |
24.9 |
|
Current facilities and their quality should be improved |
340 |
36.2 |
|
Religious tourism investments should be increased |
122 |
13.0 |
|
All resources should be introduced to tourism |
220 |
23.4 |
Note. Calculated in the SPSS program by authors.
In the Likert scale, which is used in the research, expressions range from (1) ‘strongly disagree’ to (5) ‘strongly agree’. After the factor analysis, the arithmetic mean is employed while calculating total scale scores or dimensions of the factors. Total scale scores and factor (dimension) scores distribute to a width of 5.00-1.00=4.00. Dividing the width into five, the levels which determine the breakpoints of the scale are identified. In the evaluation of the scale statements, evaluations can be based on scores ranging from 1.00-
1.79 as very weak; 1.80-2.59 as weak; 2.60-3.39 as average; 3.40-4.19 as strong; and 4.20-5.00 as very strong.
According to Figure, it is found out that the level of residents’ «attitudes towards the development of tourism» is weak (2.179 ± 1.157); the level of «lack of tourism consciousness in residents and administrators» is average (2,831 ± 1,144); the level of «belief in the contribution of tourism» is weak (2.262 ± 1.181); the level of «social and environmental damage» is average (3.116 ± 1.120); the level of «negative cultural impacts» is average (3.094 ± 1.207); the level of «tourism potential of Turkestan» is weak (2.450 ± 0.951); and the level of «negative impacts of tourism on daily life» is average (2.689 ± 1.192).
In many ways, this situation is explained in the following figure (Fig.).
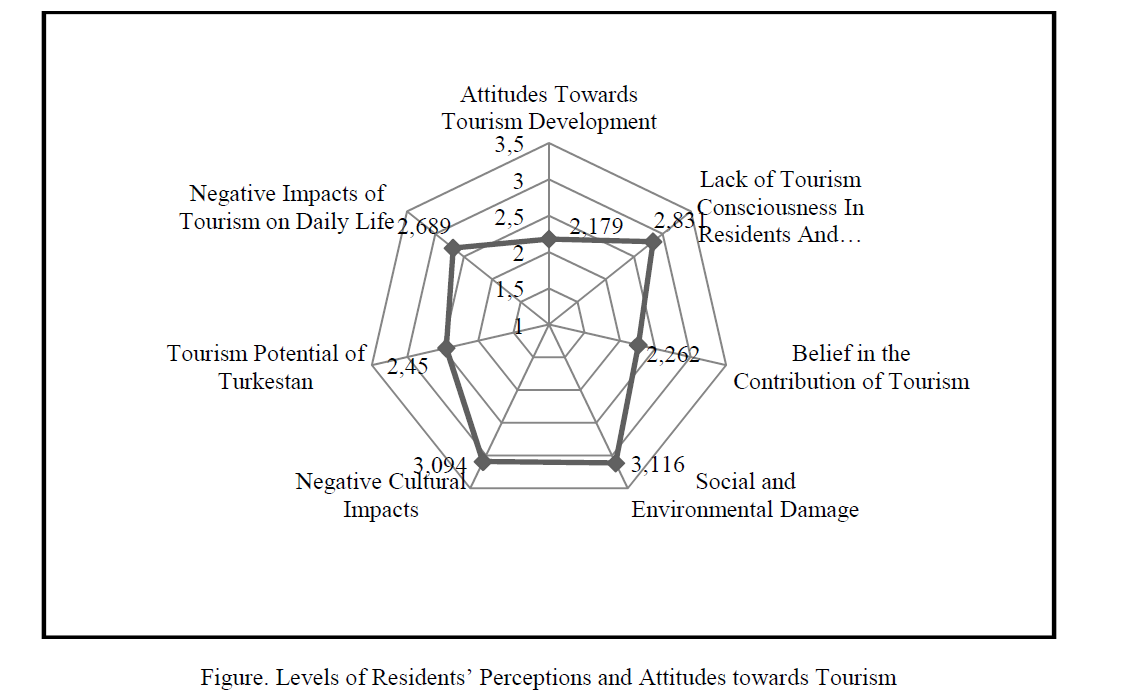
Figure. Levels of Residents’ Perceptions and Attitudes towards Tourism
As a result of the one-way variance analysis (Anova), which is carried out in order to determine whether there is a meaningful difference between the averages of the scores of lack of tourism consciousness in residents and administrators in relation to the variable of educational backgrounds, the difference between the averages of the groups is found statistically meaningful (F=3.819; p=0.010<0.05). When complementary post-hoc analysis is used to determine the sources of the differences, it is found out that the difference is due to graduate education and that respondents with graduate education have the highest level of tourism consciousness (Table 8).
T a b l e 8
Averages of Residents’ Perceptions and Attitudes towards Tourism in terms of Educational Backgrounds
|
|
Group |
N |
Mean |
SD |
F |
p |
Difference |
|
Lack of Tourism Consciousness in Residents and Administrators |
Elementary |
187 |
2.852 |
1.173 |
3.819 |
0.010 |
1>4 2>4 3>4 |
|
High School |
290 |
2.831 |
1.102 |
||||
|
University |
364 |
2.915 |
1.150 |
||||
|
Graduate |
99 |
2.480 |
1.133 |
||||
|
Belief in the Contribution of Tourism |
Elementary |
187 |
2.447 |
1.174 |
6.943 |
0.000 |
1>3 2>3 1>4 2>4 |
|
High School |
290 |
2.424 |
1.261 |
||||
|
University |
364 |
2.097 |
1.108 |
||||
|
Graduate |
99 |
2.047 |
1.109 |
||||
|
Social and Environmental Damage |
Elementary |
187 |
3.187 |
1.078 |
10,909 |
0,000 |
1>2 3>2 3>4 |
|
High School |
290 |
2.859 |
1.053 |
||||
|
University |
364 |
3.330 |
1.206 |
||||
|
Graduate |
99 |
2.944 |
0.868 |
Note. Calculated in the SPSS program by authors.
As a result of the analysis, which is carried out in order to determine whether there is a meaningful difference between the mean scores of Turkestan residents’ believes in the contribution of tourism in relation to educational backgrounds, it is found out that the difference between the averages of the groups is found statistically meaningful (F=6.943; p=0.000<0.05). Considering the sources of the differences, compared to the respondents with elementary and high school education, respondents with university and graduate education believe less in the contribution of tourism.
As a result of the analysis, which is carried out to determine whether there is a meaningful difference in residents’ perspectives on social and environmental damage in relation to their educational backgrounds, the difference between the averages of the groups is found statistically meaningful (F=10.909; p=0.000<0.05). Considering the sources of the differences, it is found that compared to the respondents with high school and graduate education, respondents with elementary and university graduations have higher scores in social and environmental damage.
As a result of one-way variance analysis (Anova) which is carried out to determine whether the mean of respondents’ scores on residents' attitudes towards tourism development show a meaningful difference in relation to the variable of monthly income, it is revealed that the averages of the groups have a statistically meaningful difference (F=2.894; p=0.034<0.05). As a result of the complementary post-hoc analysis which is carried out to determine the sources of differences, it is found out that differences arise from the people who have 400 $ or more monthly income. In Table 9, it is understood that people who have the highest income, also have the strongest attitudes towards tourism development.
T a b l e 9
Averages of Residents’ Perceptions and Attitudes towards Tourism in terms of Monthly Income
|
|
Group |
N |
Mean |
SD |
F |
P |
Difference |
|
1 |
2 |
3 |
4 |
5 |
6 |
7 |
8 |
|
Attitudes towards Tourism Development |
Under 100 |
310 |
2.238 |
1.136 |
2.894 |
0.034 |
4 > 2 4 > 3 |
|
100-200 |
301 |
2.064 |
1.098 |
T a b l e 9 c o n t i n u a t i o n
|
1 |
2 |
3 |
4 |
5 |
6 |
7 |
8 |
|
|
200-400 |
281 |
2.174 |
1.199 |
|
|
|
|
Over 400 |
48 |
2.546 |
1.314 |
||||
|
Lack of Tourism Consciousness in Residents and Administrators |
Under 100 |
310 |
2.668 |
1.076 |
4.881 |
0.002 |
3 > 1 4 > 1 4 > 2 |
Note. Calculated in the SPSS program by authors.
As a result of one-way variance analysis (Anova) which is carried out to determine whether the mean of respondents’ scores on the lack of tourism consciousness in residents and administrators show a meaningful difference in relation to the variable of monthly income, it is revealed that the averages of the groups have a statistically meaningful difference. (F=4.881; p=0.002<0.05). As a result of the complementary post-hoc analysis which is carried out to determine the sources of differences, it is determined that people whose monthly income is 400 $ or more show difference from the ones whose monthly income is 100 $ or less, and the ones who have 100-200 $ monthly income; and people who have 200-300 $ monthly income also show difference from the ones who have 100$ or less monthly income.
As a result of one-way variance analysis (Anova) which is carried out to determine whether the average of the respondents’ scores on lack of tourism consciousness in residents and administrators show a meaningful difference in relation to the variable of nationality (Table 10), it is found out that the averages of the groups have a statistically meaningful difference. (F=2.168; p=0.028<0.05). A complementary post-hoc analysis is carried out to determine the sources of differences. It is found out that the scores of respondents, whose nationality is defined as ‘others’, on the lack of tourism consciousness in residents and administrators are higher (4.036 ± 0.983) than the scores of those whose nationality is Kazakh (2.857 ± 1.156), Kyrgyz (2.688 ± 1.142), Uzbek (2.823 ± 1.124), Turkish (2.526 ± 0.882), Turkmen (2.762 ± 1.001), and Russian
(2.750 ± 1.130). It is also found out that the scores of the Kazakh on the lack of tourism consciousness in residents and administrators are higher (2.857 ± 1.156) than the Azeri (2.213 ± 0.922). Moreover, it is found out that the scores of the Uzbek on the lack of tourism consciousness in residents and administrators are higher (2.823 ± 1.124) than the Azeri (2.213 ± 0.922). It is also found out that the scores of the Tatar on the lack of tourism consciousness in residents and administrators are higher (3.133 ± 1.362) than the Azeri (2.213 ± 0.922).
T a b l e 1 0
Averages of Residents’ Perceptions and Attitudes towards Tourism in terms of Nationality
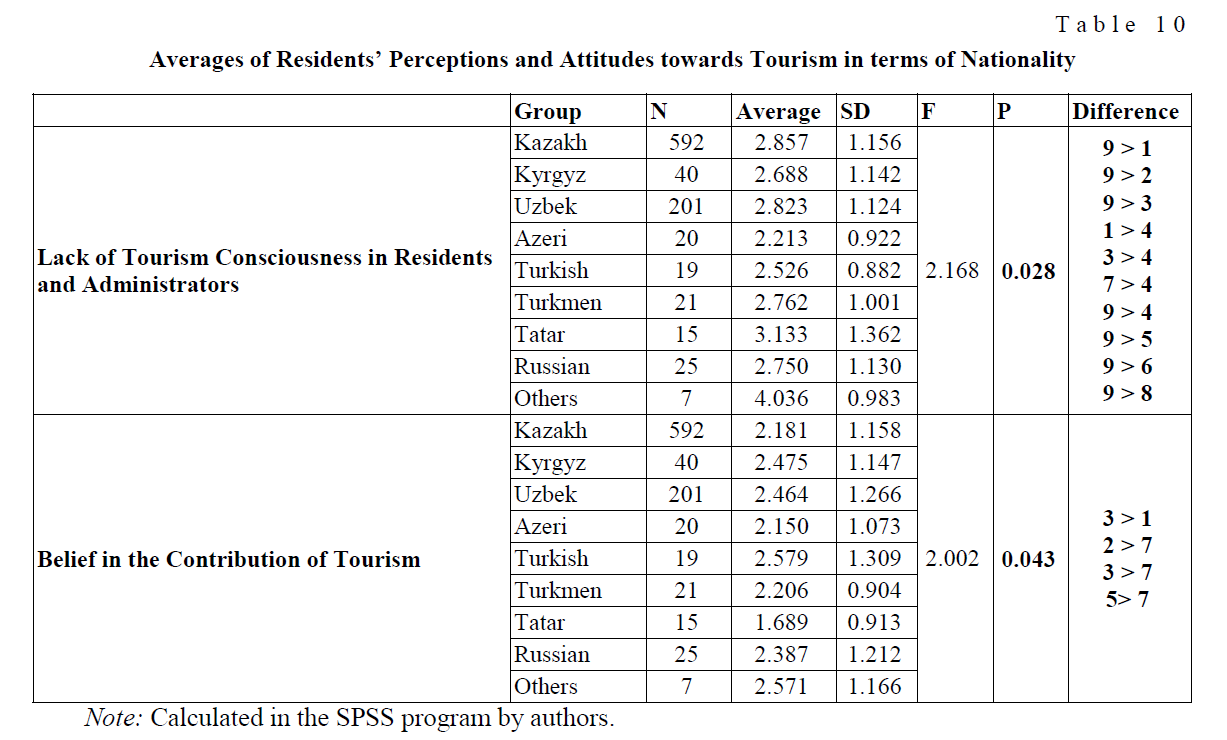
Note: Calculated in the SPSS program by authors.
As a result of one-way variance analysis (Anova) which is carried out to determine whether the averages of the respondents’ scores on Residents’ Belief in the Contribution of Tourism show a meaningful difference in relation to the variable of nationality, it is found out that the averages of the groups have a statisti- cally meaningful difference (F=2.002; p=0.043<0.05).A complementary post-hoc analysis is carried out to determine the sources of differences. It is found out that the scores of the Uzbek on the Residents’ Belief in the Contribution of Tourism are higher (2.464 ± 1.266) than the Kazakh (2.181 ± 1.158) and the Tatar (1.689 ± 0.913). It is also found out that the scores of the Kyrgyz on the Residents’ Belief in the Contribution of Tourism are higher (2.475 ± 1.147) than the Tatar (1.689 ± 0.913). It is also found out that scores of the Turkish on the Residents’ Belief in the Contribution of Tourism are higher (2.579 ± 1.309) than the Tatar (1.689 ± 0.913).
Determining the residents’ tourism tendency, which is a significant shareholder in a planned tourism development model, is important. Tourism investment is gradually increasing also in Kazakhstan, which will host EXPO 2017. Turkestan, which is the spiritual capital of the Turkic world and an important religious centre for both Kazakhstan and the Turkic world, forms the scope of this research. In the research, it is aimed to determine what is needed for tourism development by examining tourism from residents’ perspective. 1000 questionnaire forms which are prepared as a means of gathering data are delivered in Turkestan, and 940 questionnaire forms are retrieved for the evaluation.
When the questionnaire results are analysed, it is remarkable that Turkestan residents perceive tourism as an economic activity whereas their attitude towards tourism development is weak. In addition, the fact that residents’ perceptions of the social and environmental damage of tourism along with its negative impacts on culture support these conclusions emerges as another important result of the research.
When respondents’ demographic features are analysed, it is understood that the majority of respondents are between the ages of 18-30, university students or graduated, Kazakh, civil servants, and women. When respondents’ travel habits are analysed, it is seen that the majority of them rarely go on holiday and they spend their holiday in Kazakhstan. The reason why the participation to international tourism movement is low can be stated as Turkestan residents’ low income level. When respondents’ income levels are analysed, it is found out that a majority of residents (95 %) have an income under 400 $. 96 % of the respondents have been living in the area for more than 10 years. This data supports naming the respondents as residents.
When Turkestan residents’ answers to the questions about their perceptions of tourist and tourism are analysed, it is understood that most of them define a tourist as the person who brings currency, and define tourism as an economic activity. When they are asked about tourism facilities, most of the respondents state that current facilities should be improved and their quality should be increased. Regarding this result, it can be stated that current facilities have some deficiencies in terms of exterior and interior decorations, hygiene and service quality. It is remarkable that 23.3 % of the respondents mark ‘Tourism facilities are not attractive for me» and 24.9 % of the respondents mark ‘Tourism facilities are almost adequate’.
As a result of the analysis of the propositions presented in Likert scale with the aim of measuring residents’ perceptions and attitudes towards tourism in Turkestan, seven factors are determined. Those factors are as follows: Negative effects of tourism on daily life, tourism potential of Turkestan, negative cultural effects, social and environmental damage, belief in contribution of tourism, lack of tourism consciousness in residents and administrators, and attitudes toward tourism development. When the averages of residents’ perceptions and attitudes towards tourism are calculated in relation to educational backgrounds, statistically meaningful differences are found out in terms of lack of tourism consciousness in residents and administrators, belief in contribution of tourism, and social and environmental damage. One of the most remarkable results of these differences is that respondents with graduate education have the highest tourism consciousness compared to the respondents with other educational backgrounds. Respondents with graduate education show the least levels of responses to the negative statements regarding perceptions of tourism. After the respondents with high school education, respondents with graduate education show the second least levels of responses to the negative statements regarding social and environmental damage of tourism which is a sub factor of social and environmental damage; and, hence, they differ from the respondents with university education.
Although Kazakh population is dominant in Turkestan, there are residents of various nationalities living in the city. Based on this fact, the averages of the residents’ perceptions and attitudes towards tourism in relation to nationality reveal statistically meaningful differences between the factors of lack of tourism consciousness in residents and administrators, and belief in the contribution of tourism.
The study is significant in that it is the first study carried out specifically in Turkestan and in this scope. It would also be beneficial to carry out similar studies in other tourism shareholders. Additionally, considering the fact that tourism in Kazakhstan has recently started to develop, there is a necessity for similar studies in other regions that would guide tourism planners.
Kazakhstan will host Expo 2017 in Astana. In addition, UNESCO declared the year of 2016 as Khoja Akhmet Yassawi year to commemorate the 850th anniversary of his death. All these improvements are great opportunities for Kazakhstan, specifically for Turkestan. To benefit from these opportunities, and, to increase facilities and service quality specifically in Turkestan, necessary investments should be carried out, and qualified services should be rendered. Training and certification programmes for residents and businesses should be arranged in order to internalize and apply international service and hygiene rules, and increase tourism consciousness.
References
- Hwan-Suk, C.C. & Sırakaya, E. (2005). Measuring Residents’ Attitude Toward Sustainable Tourism: Development of Sustainable Tourism Attitude Scale. Journal of Travel Research. 43(4), 380–394.
- Tezcan, M. (2012). Sosyolojiye Giriş, Ankara: Şafak Matbaacılık [in Turkish].
- Rocharungsat, P. (2004). Community-Based Tourism: The Perspectives of Three Stakeholder Groups, Proceedings of the New Zealand Tourism and Hospitality Research Conference. Wellington, 335–347.
- Duran, E. ve Özkul, E. (2012). Yerel Halkın Turizm Gelişimine Yönelik Tutumları: Akçakoca Örneği Üzerinden Bir Yapısal Model. International Journal of Human Sciences, 9(2), 500–520 [in Turkish].
- Williams, J. & Lawson. R. (2001). Community Issues and Resident Opinions of Tourism. Annals of Tourism Research, 28(2), 269–290.
- Presenza, A., Del Chiappa, G. & Sheehan, L. (2013). Residents’ Engagement and Local Tourism Governance in Maturing Beach Evidence From an İtalian Case Study. Journal of Destination Marketing & Management, 2(1), 22–30.
- Doğan, H. ve Üngüren, E. (2012). Yerel Halkın Isparta Turizmine Yönelik Görüşleri Üzerine Bir Araştırma. Süleyman Demirel Üniversitesi İktisadi ve İdari Bilimler Fakültesi Dergisi, 17(1), 103–122 [in Turkish].
- Özdemir, M. A. ve Kervankıran, İ. (2011). Turizm ve Turizmin Etkileri Konusunda Yerel Halkın Yaklaşımlarının Belirlenmesi: Afyonkarahisar Örneği. Marmara Coğrafya Dergisi, 25, 1–25 [in Turkish].
- Giritlioğlu, İ. ve Bulut, E. (2015). Yerel Halkın Bakış Açısına Göre Gaziantep Turizmi ve Sürdürülebilirlik, Uluslararası Sosyal ve Ekonomik Bilimler Dergisi, 5(1), 25–31 [in Turkish].
- Toprak, (2015). Mardin’de Halkın Turizm Algısı, Elektronik Sosyal Bilimler Dergisi, 14(54), 201–218 [in Turkish].
- Dyer, P., Gursoy, D., Sharma B. & Carter, J. (2007). Structural Modeling of Resident Perceptions of Tourism and Associated Development on The Sunshine Coast, Australia, Tourism Management, 28, 409–422 [in Turkish].
- Harrill, R. (2004). Residents' Attitudes Toward Tourism Development: a Literature Review with Implications for Tourism Planning, Journal of Planning Literature, 18(1), 251–266. Retrieved from http://unesco.org.tr/dokumanlar/duyurular/ak2605201515088.pdf.
- Besculides, A., Martha E. Lee & Peter J. M., (2002). Residents’ Perceptions of the Cultural Benefits of Tourism, Annals of Tourism Research, 29(2), 303–319.