The regular documentation of glucose measurements during insulin and / or oral drug therapy, meal intake, and special events in the daily life are crucial for doctors in the treatment of patients with diabetes mellitus. Therefore, we developed a method, which allows objective, rapid and comprehensive review of glucose profiles for the first time. On the basis of glucose values, either recorded by self-monitoring of blood glucose or by a continuous glucose monitoring with a sensor system, the Q-Score can easily be computed. Classification by Q-Score is simple, time-saving, and useful in terms of daily treatment routine. In addition, it involves analysis of the contribution of individual glycemic components expressed as the Q-Score and enables assessment of therapeutic efficacy. The method for determining the Q-Score, evaluation of glucose readings and self-control data as well as presentation of results and the therapeutic advancement will be implemented into the telemedicine information and communication system TeleDIAB®, which is available via world-wide.
Introduction
HbA1c reflects glycemic control of the last 8–12 weeks and is the gold standard in diabetes care. However, the advantage of glucose profiles for the assessment of metabolic control is actually intensively discussed [1–3]. Among others, glucose profiles allow evaluation of the variability, show trends for hypoglycemic events, and can be used to find causal relationships between glucose excursions, therapeutic interventions, and meal intake. Glucose profiles representing the actual metabolic control of the patient and are suitable to detect deficiencies in the metabolic management. In order to characterize glucose profiles and find appropriate parameters, a large number of studies have provided a bulk of data. More than 30 metrics for characterization of glucose profiles were published of which each focused only on a single aspect, e.g. the variability within one day, the mean glucose level, risk for hypoor hyperglycemia and the mean of daily differences in the course of glucose measurements [4–17]. Routine clinical use by calculating up to 30 parameters for complete characterization of glucose profiles seems to be unrealistic. Moreover, an intraand inter-individual comparison of glucose profiles will be difficult or even impossible. Therefore, we have recently developed a method that allows for the first time objective assessment of the quality of glucose profiles by calculating one single value, which we call Q-Score [18]. The Q-Score integrates 5 specific components of glucose profiles into a single value. Using the Q-score, physicians can obtain both an objective assessment of glucose profiles from their patients and derive therapeutic recommendations to improve glycemic control.
Methods
Using historical data from continuous glucose monitoring (CGM, n = 1562), 15 parameters, which are considered important for assessment of glucose profiles were calculated. The CGM data were obtained during a diabetes care program running from 2006 to 2010 in Germany. In order to identify those factors that determine the characteristics of the glucose profiles, a factor analysis with principal component analysis and varimax rotation was performed. This analysis yielded five primary factors that determined the glucose profile characteristics. As shown in Figure 1, these factors are mean glucose, glucose range, hypoglycemia (thypo), hyperglycemia (thyper), and mean of daily difference (MODD) which were used for constructing the formula for calculation of the Q-Score.
For practical use, the Q-Score was classified into the following categories: no risk, very low risk, moderate risk, high risk, and dangerous (Figure 2). This classification was verified by evaluation of n = 766 CGM profiles by independent diabetes specialists. They allocated the CGM profiles to one of the classifications listed below. The results of the classification were highly correlated with the specialists judgement (Kendall’s tau = 0.671, 0.787 and 0.751; p < 0.001).
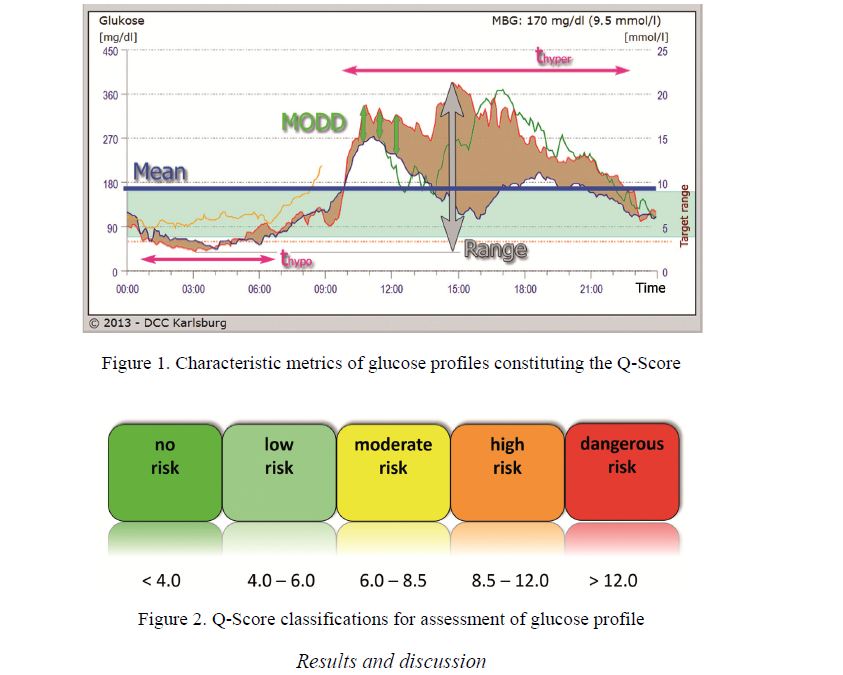
Figure 1. Characteristic metrics of glucose profiles constituting the Q-Score
Figure 2. Q-Score classifications for assessment of glucose profile
Results and discussion
To probe the «selectivity» of the Q-Scores, glucose profiles of patients with diabetes were assigned to each of the category indicated in Figure 3. It can be seen that the values of the Q-Score correlated very well with the quality of glycemic control, as reflected by the glucose profiles of diabetic patients. Unlike the HbA1c value, regarded as long-term parameter for glycemic control, the Q-Score provides an objective view of the current metabolic status. For the Q-Score, the following categories were established: «no risk» < 4.0; «very low risk» 4.0 to 6.0; «moderate risk» from 6.0 to 8.5; «high risk» 8.5 to 12.0; «dangerous» > 12.0.
The assessment of glucose profiles using the Q-Scores shows the attending physician immediately the current status of metabolic control of his/her patients. Such a profound and grounded evaluation can not be derived from notebook or diary entries [19]. The calculation of the Q-Score provides an objective assessment of the glucose profiles whereas the assessment of diary data by more than one people may lead to individual differences. In contrast to existing services using notebook or diary data providing statistical methods to assist judgment of glycemic control the Q-Score summarizes important components for estimating the risk. This could be of advantage in routine clinical use.
One might ask what is the advantage of the Q-Score over other evaluation methods have? — Demonstrated by 3 examples of glucose profiles for each category in Figure 3, it can be seen that the individual glucose profile patterns within a specific category, e.g. in the case of «high risk», are different. This is due to the fact that, in individual cases, different factors contribute to the classification as «high risk». The profiles of the middle graph (Q-Score = 8.9) in the category «high risk» are characterized by pronounced hypoglycemic phases, whereas in the left panel (Q-Score 10.2) hyperglycemia is the main problem for poor metabolic control. Thus, the Q-Score addresses pertinent problems in relation to the current metabolic control.
As afore-noted, various components are involved in the evaluation of daily glucose profiles and calculation of the Q-Score, as illustrated in Figure 3. Analysis of the quantitative contribution of each component provides the therapeutic potential for improvement of glycemic control and can thus be used for personalized recommendations to overcome weakpoints (Fig. 4).
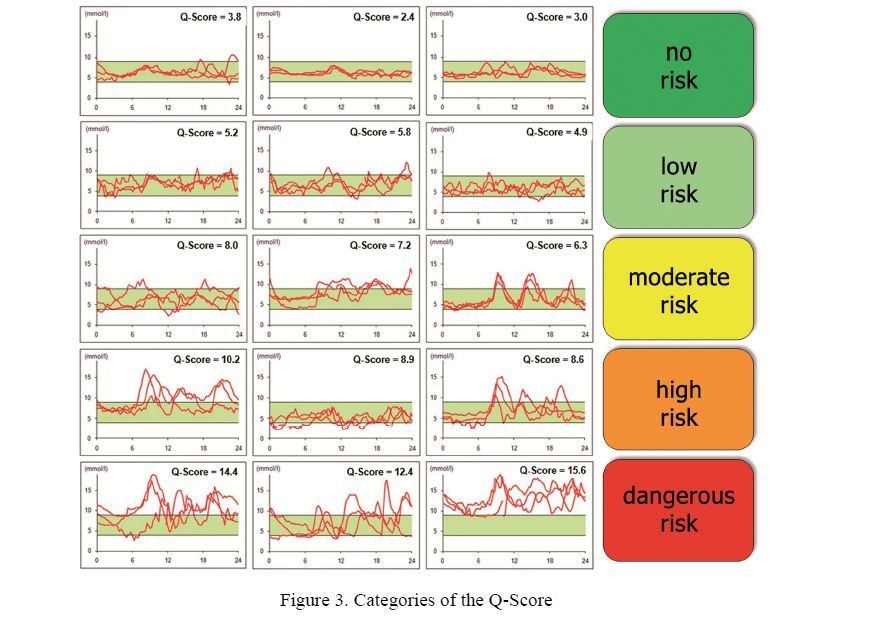
Figure 3. Categories of the Q-Score
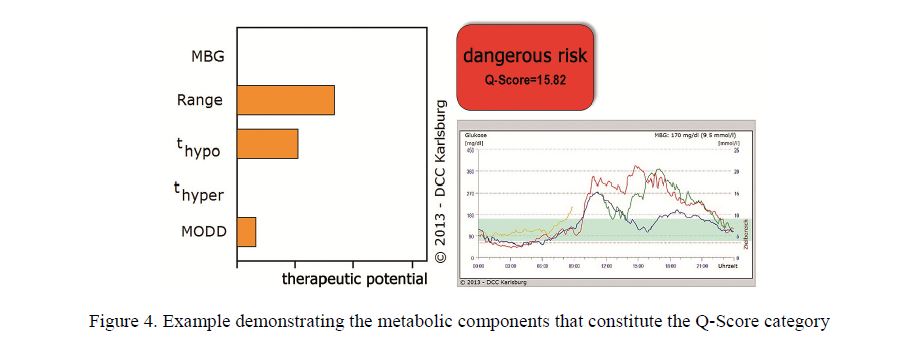
Figure 4. Example demonstrating the metabolic components that constitute the Q-Score category
In the example shown in Fig. 4, both the nocturnal hypoglycemia and the large day-time variation of glucose levels are mainly responsible for the poor metabolic control. The differences between the individual 24-h profiles (MODD) are pronounced only during daytime hours, while at night, almost identical curves with low glucose levels are observed. This leads to the conclusion that in this case changing eating behavior may be beneficial to reduce hyperglycemia. The nocturnal phases of hypoglycemia, however, could indicate that overdosing of antidiabetic medication is the main problem in controlling glycemia. Overall, these examples demonstrate how valuable evaluation and assessment of glucose profiles could be for a family physician, using the Q-Score.
For the case shown in Figure 4, the corresponding results of therapeutic interventions based on the QScore analysis are demonstrated in Figure 5. Glucose monitoring after 12 and 24 months was accompanied by subsequent improvement in the Q-Score, illustrating close relationships between scoring and metabolic control.
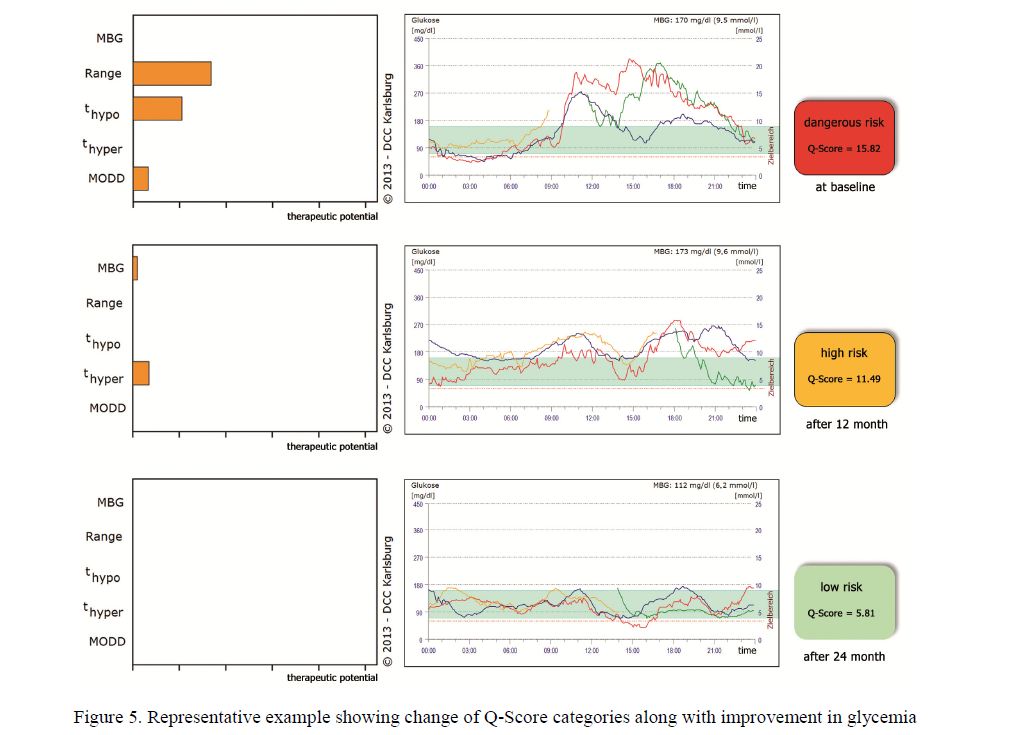
Figure 5. Representative example showing change of Q-Score categories along with improvement in glycemia
Especially when glucose measurement is performed with test strips, as it is usually the case in the majority of patients, objective and comparable assessment of metabolic control could be obtained by using the KADIS®Program [18] and calculation of the Q-Score. Additional laboratory tests are not required for calculation of the Q-Score to get the full picture of the patient´s glycemic status. As there are additional therapeutic recommendations that can be derived, the presented approach could be a useful innovation for doctors and patients. Also the online availability will substantially expand the usefulness of the Q-Scores.
References
- Pfützner A., Mitri M., Musholt P.B., Sachsenheimer D., Borchert M., Yap A., Forst T. Clinical assessment of the accuracy of blood glucose measurement devices // Curr. Med. Res. Opin. — 2012. — Vol. 28, No. 4. — P. 525–531.
- Krishna S., Boren S.A., Balas E.A. Healthcare via Cell Phones: A Systematic Review // Telemedicine and e-Health. — Vol. 15, No. 3. — P. 231–240.
- Bergenstal R.M., Ahmann A.J., Bailey T., Beck R.W., Bissen J., Buckingham B., Deeb L., Dolin R.H., MD, Garg S.K., Goland , Hirsch I.B., Klonoff D.C., Kruger D.F., Matfin G., Mazze R.S., Olson B.A., Parkin C., Peters A., Powers M.A., Rodriguez H., Southerland P., Strock E.S., Tamborlane W., Wesley D.M. Recommendations for Standardizing Glucose Reporting and Analysis to Optimize Clinical Decision Making in Diabetes: The Ambulatory Glucose Profile (AGP) // Diabetes Technol. Ther. — 2013. — Vol. 15. — P. 198–211.
- Rodbard D. Increased Glycemic Variability at the Onset and During Progression of Type 2 Diabetes — Commentary // Diabetes Technol. Ther. — 2013. — Vol. 15. — P. 445–447.
- Chon S., Lee Y.J., Fraterrigo G., Pozzilli P., Choi M.C., Kwon M.K., Chin S.O., Rhee S.Y., Oh S., Kim Y.S., Woo J.T. Evaluation of Glycemic Variability in Well-Controlled Type 2 Diabetes Mellitus // Diabetes Technol. Ther. — 2013. — Vol. 15. — P. 455– 460.
- Siegelaar E., Holleman F., Hoekstra J.B.L., DeVries J.H. Glucose Variability; Does It Matter? // Endocrine Reviews. — 2010. — Vol. 31. — P. 171–182.
- Marling R., Shubrook J.H., Vernier S.J., Wiley M.T., Schwartz F.L. Characterizing blood glucose variability using new metrics with continuous glucose monitoring data // J. Diabetes Sci. Technol. — 2011. — Vol. 5. — P. 871–878.
- Rodbard D. New and improved methods to characterize glycemic variability using continuous glucose monitoring // Diabetes Technol. Ther. — 2009. — Vol. 11. — P. 551–565.
- Service J., Molnar G.D., Rosevear J.W., Ackerman E., Gatewood L.C., Tayler W.F. Mean amplitude of glycemic excursions, a measure of diabetic instability // Diabetes. — 1970. — Vol. 19. — P. 644–655.
- McDonnel M., Donath S.M., Vidmar S.I., Werther G.A., Cameron F.J. A novel approach to continuous glucose analysis utilizing glycemic variation // Diabetes Technol. Ther. — 2005. — Vol. 7. — P. 253–263.
- Whitelaw C., Choudary P., Hopkins D. Evaluating rate of change as an index of glycaemic variability, using continuous glucose monitoring data // Diabetes Technol. Ther. — 2011. — Vol. 6. — P. 631–635.
- Hermanides J., Vriesendorp T.M., Bosman R.J., Zandstra D.F., Hoekstra J.B., DeVries J.H. Glucose variability is associated with intensive care mortality // Crit. Care med. — 2010. — Vol. 38. — P. 838–842.
- Monnier L., Colette C. Glycemic variability: can we bridge the divide between controversies? // Diabetes Care. — 2011. — Vol. 34. — P. 1058–1059.
- Salzsieder , Vogt L., Kohnert K.D., Heinke P., Augstein P. Model-based decision support in diabetes care // Comput. Methods Prog. Biomed. — 2011. — Vol. 102. — P. 206–218.
- Kohnert K.D., Heinke P., Vogt L., Zander E., Fritzsche G., Freyse E.J., Augstein P., Salzsieder E. Reduced glucose variability is associated with improved quality of glycemic control in patients with type 2 diabetes: a 12-month observational study // J. EnMetab. — 2011. — Vol. 1. — P. 64–72.
- Fritzsche G., Kohnert K.D., Heinke P., Vogt L., Salzsieder E. The use of a computer program to calculate the mean amplitude of glycemic excursions // Diabetes Technol. Ther. — 2011. — Vol. 13. — P. 319–325.
- Kohnert D., Vogt L., Salzsieder E. Advances in understanding glucose variability and the role of glucose monitoring // European Endocrinol. — 2010. — Vol. 6. — P. 53–56.
- Monnier L., Colette C., Mas E., Michel F., Cristol J.P., Boegner C., Owens D.R. Regulation of oxidative stress by glycaemic Evidence for an independent inhibitory effect of insulin therapy // Diabetologia. — 2010. — Vol. 53. — P. 562–571.
- Salzsieder E., Vogt L., Heinke P., Augstein P. The Q-score: A new tool for objective assessment and verification of the quality of continuously measured glucose profiles // Diabetologie und Stoffwechsel. — 2011. — Vol. 6. — P.